Summer Statistics for Zürich ZH (556m)
Live data: Map / Time Series
Overview
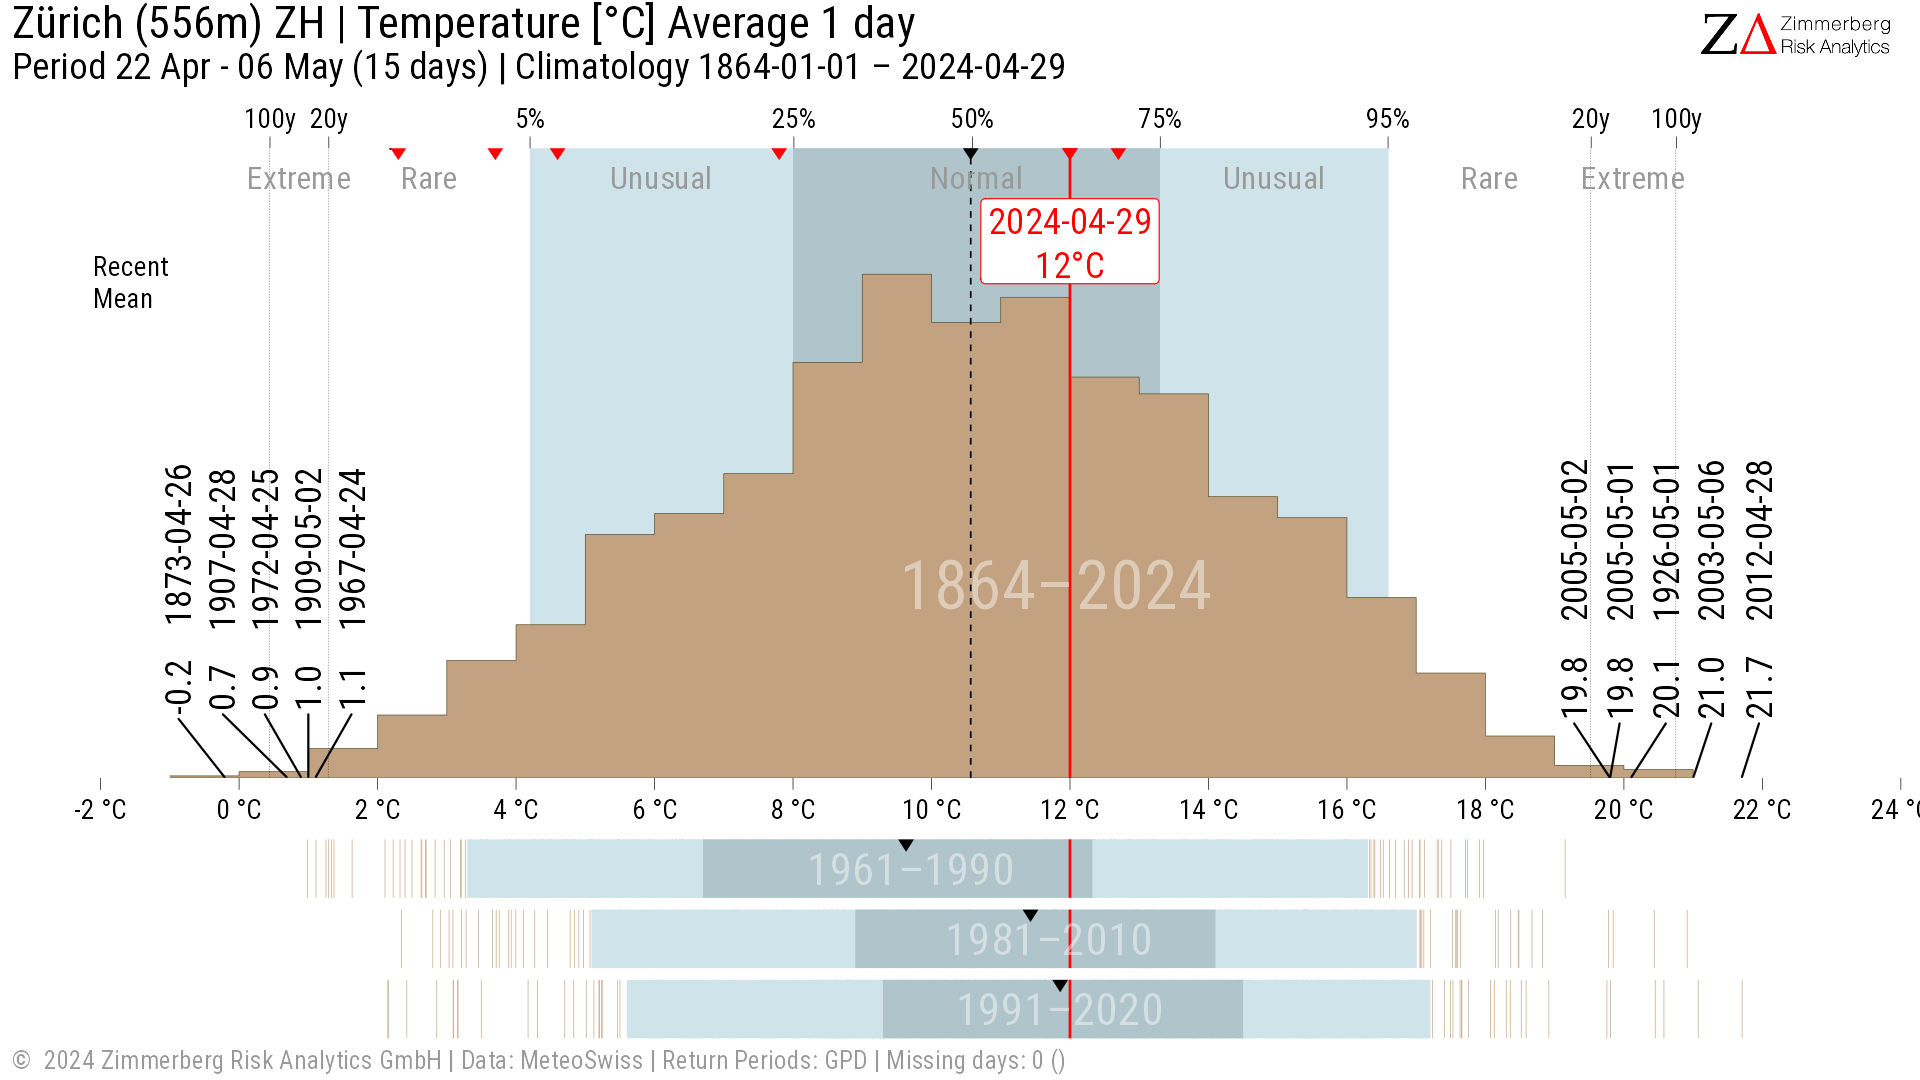
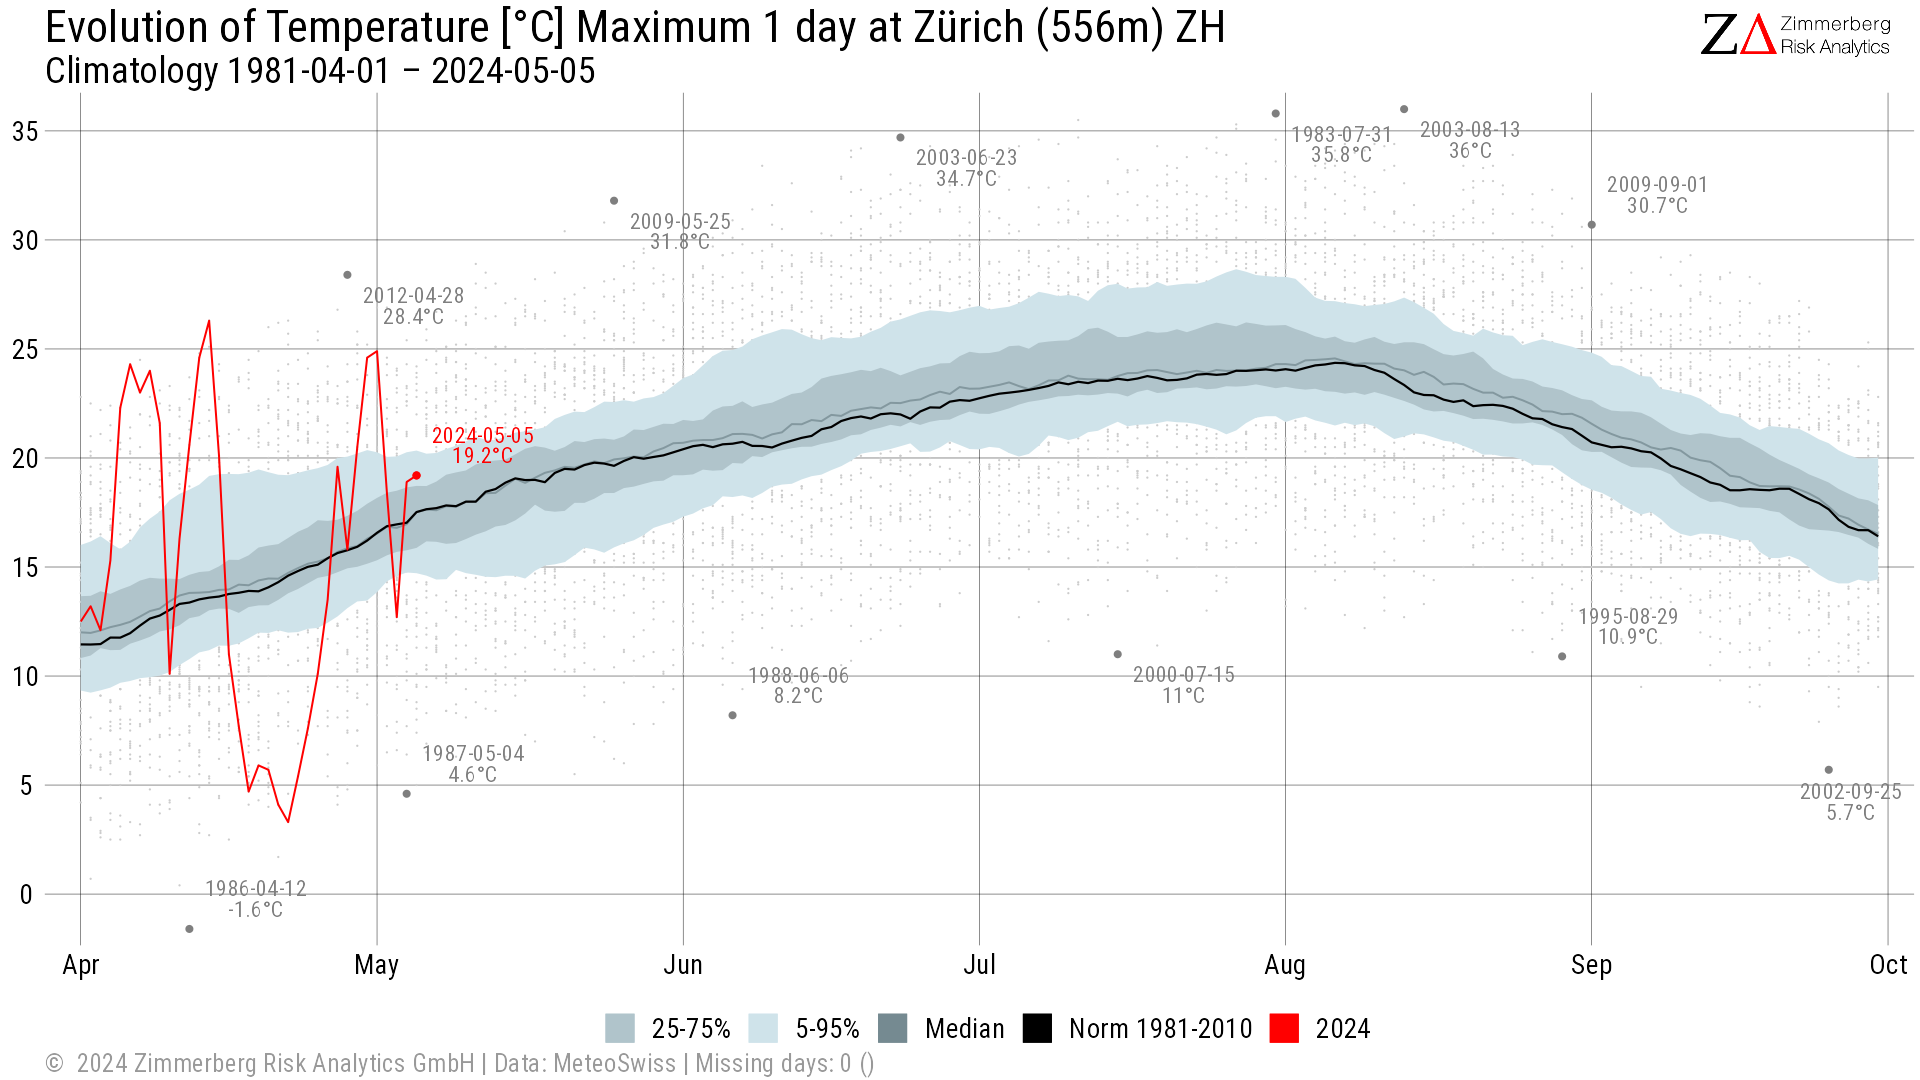
Temperature
| Rank | Year | Date | Value [°C] |
|---|
Temperature at Zürich ZH (556m) last 40 years.
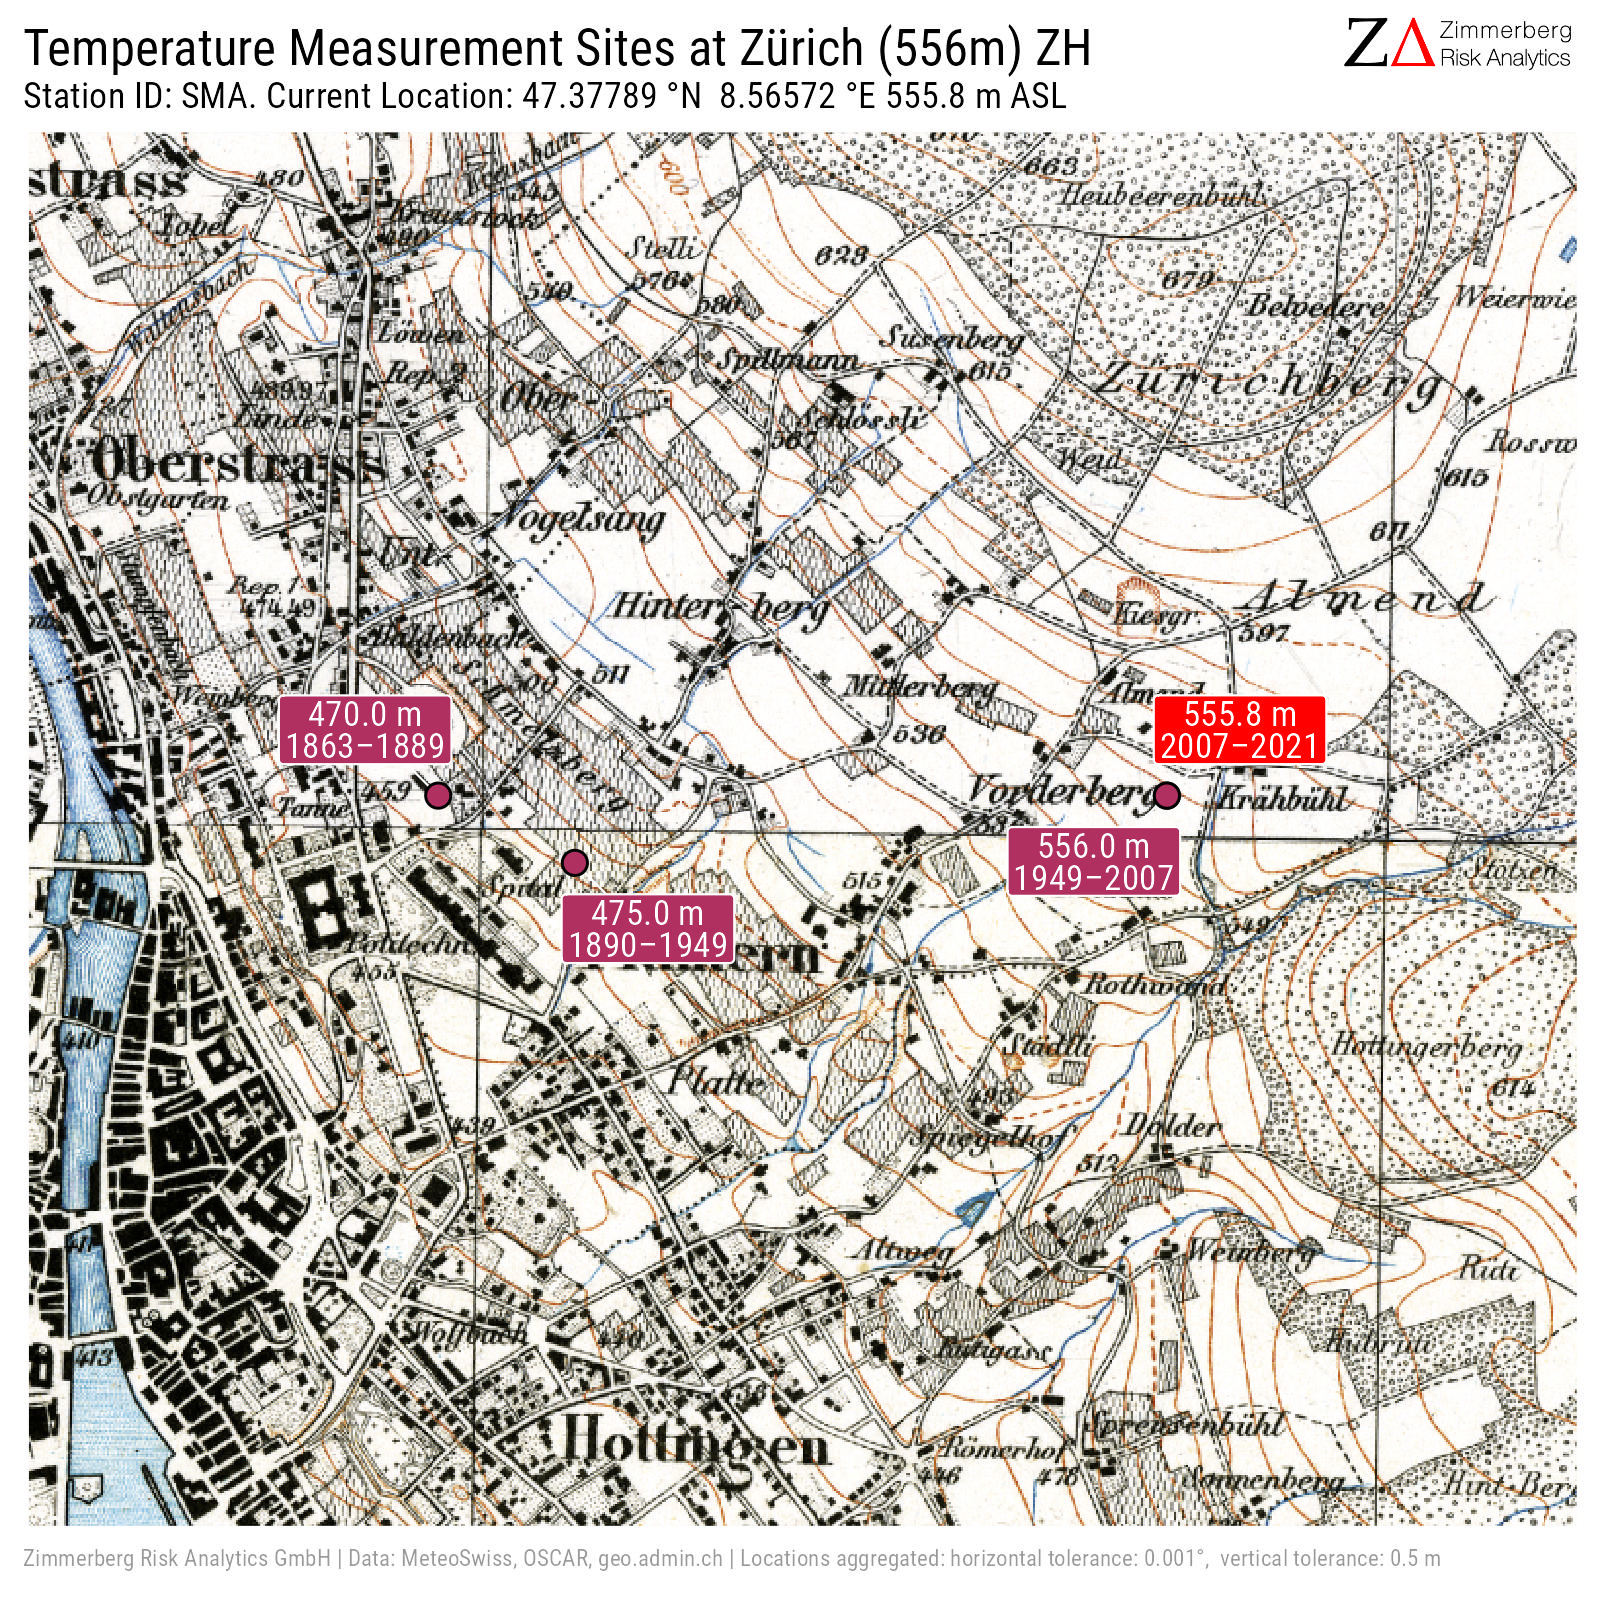
Measurement Sites History
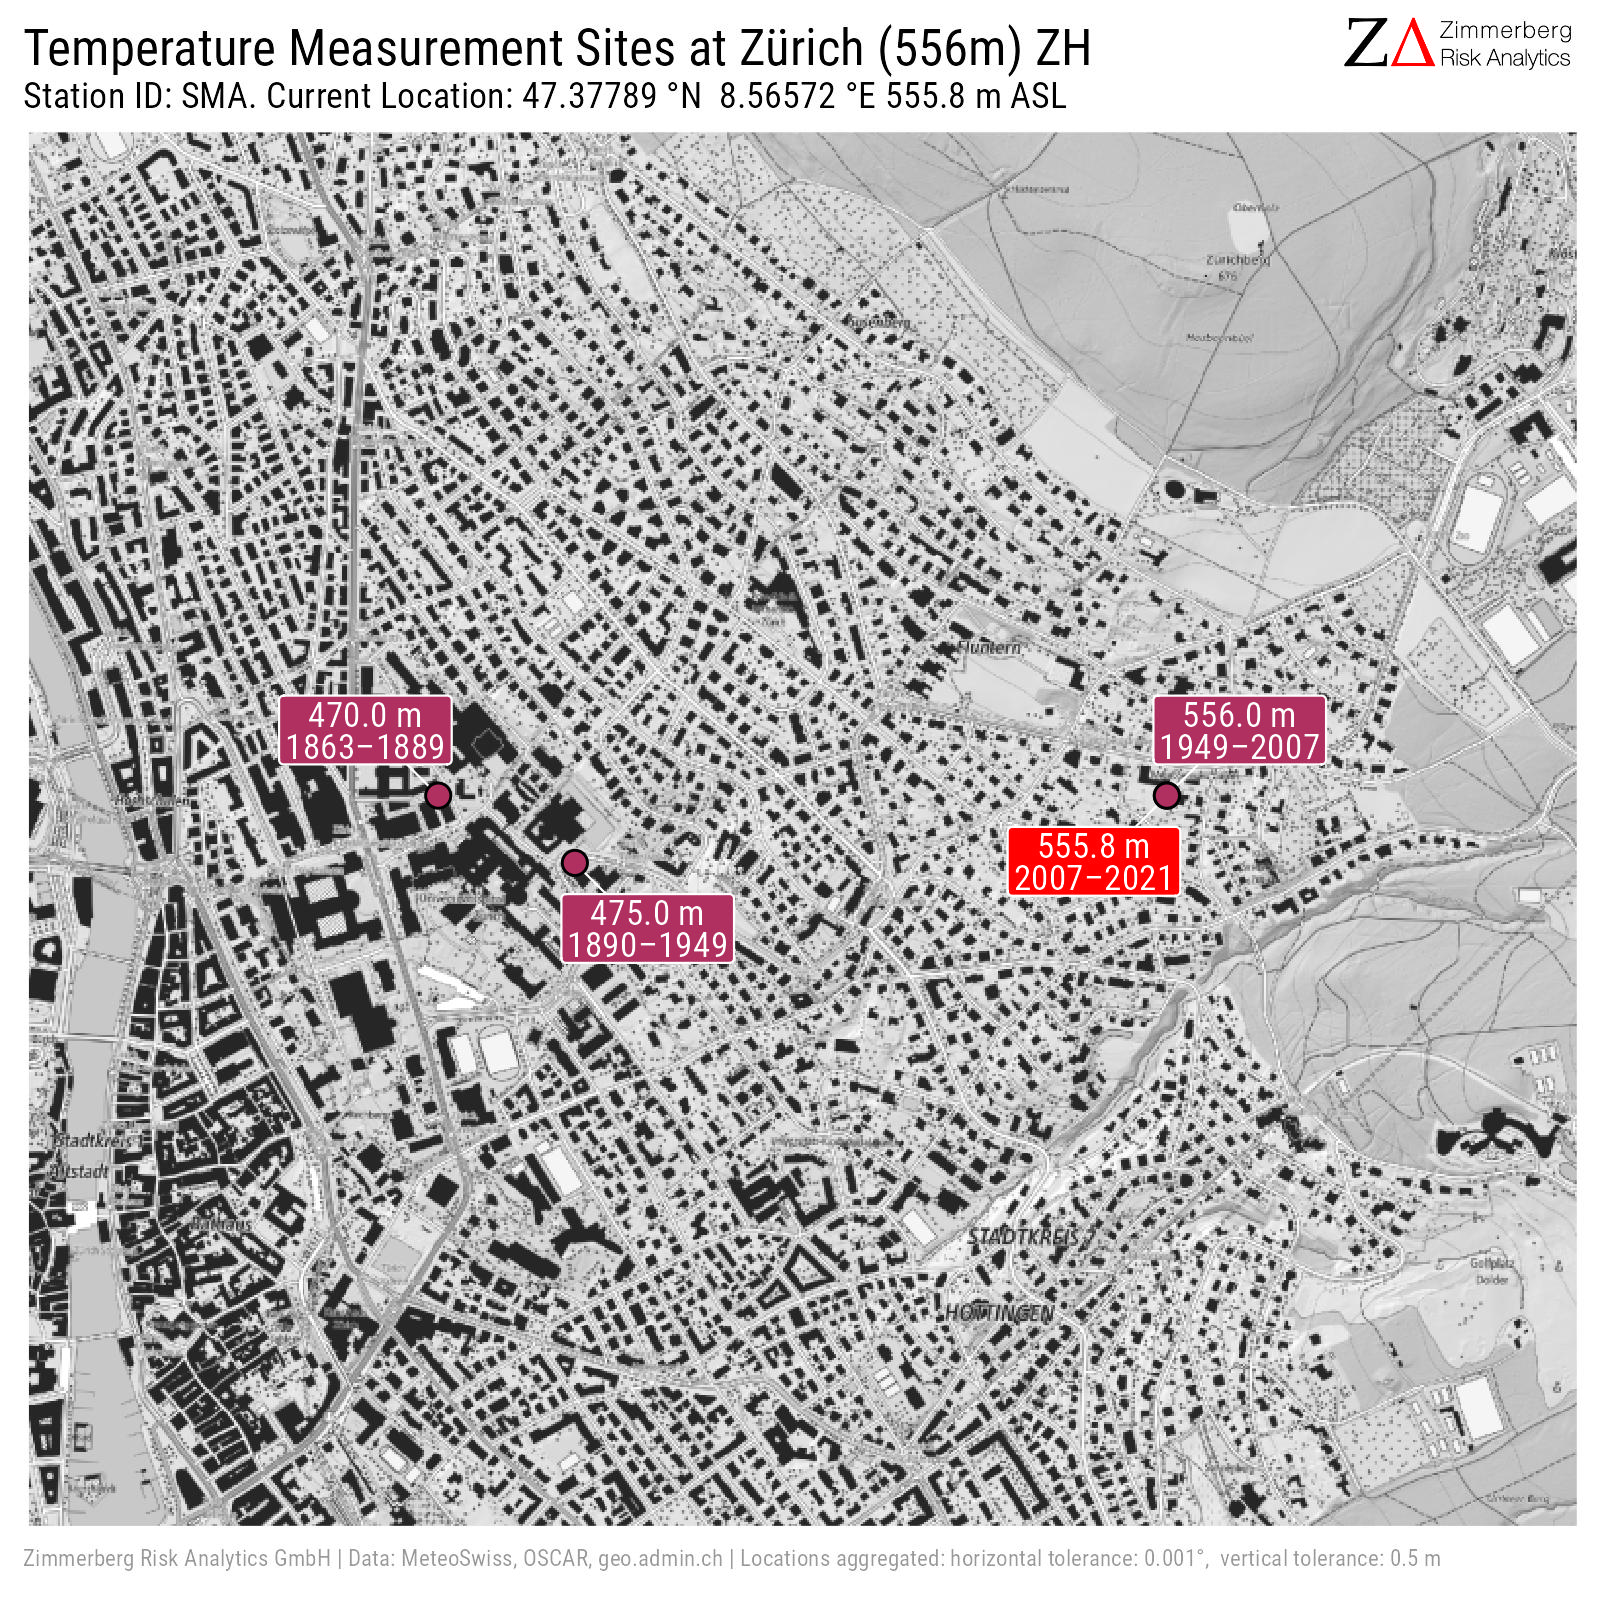
More maps:

Temperature
Daily temperature data is provided as-is (inhomogeneous). Please consult measurement site history and see MeteoSwiss website for details
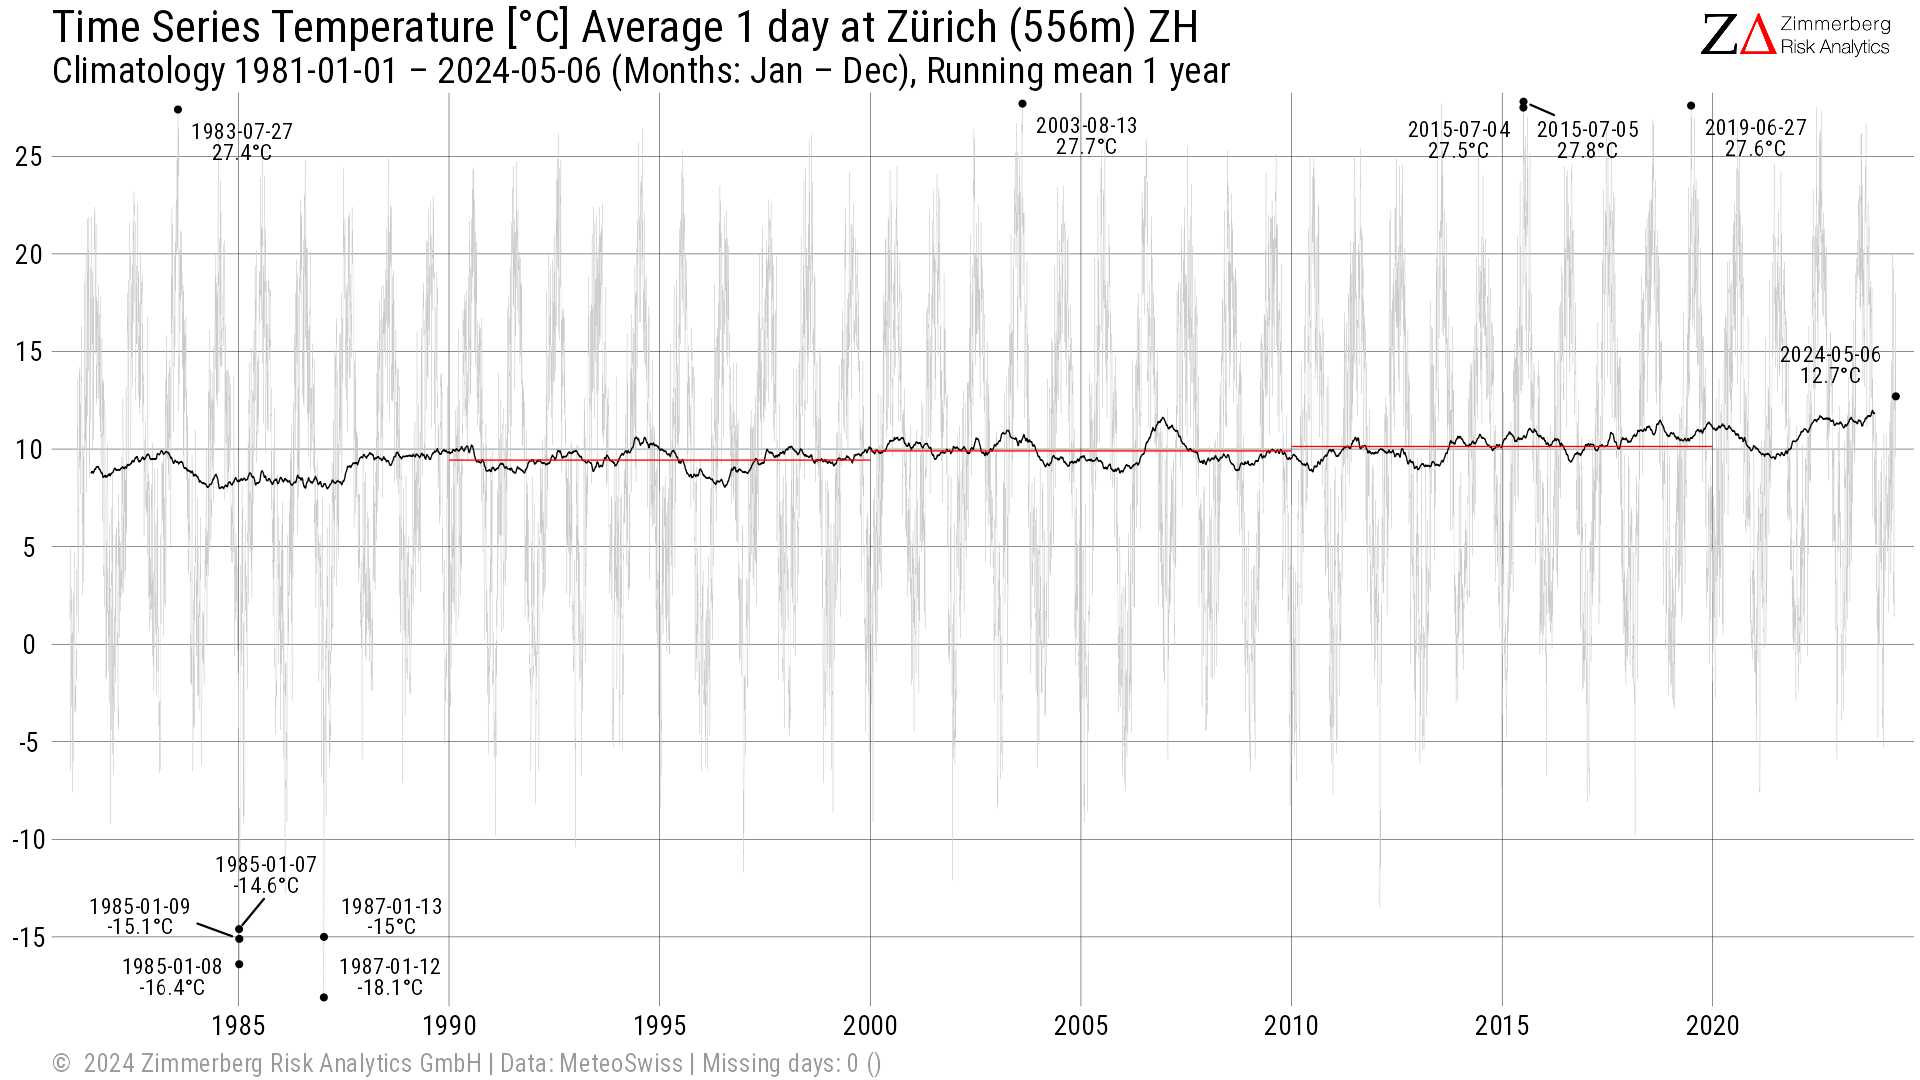
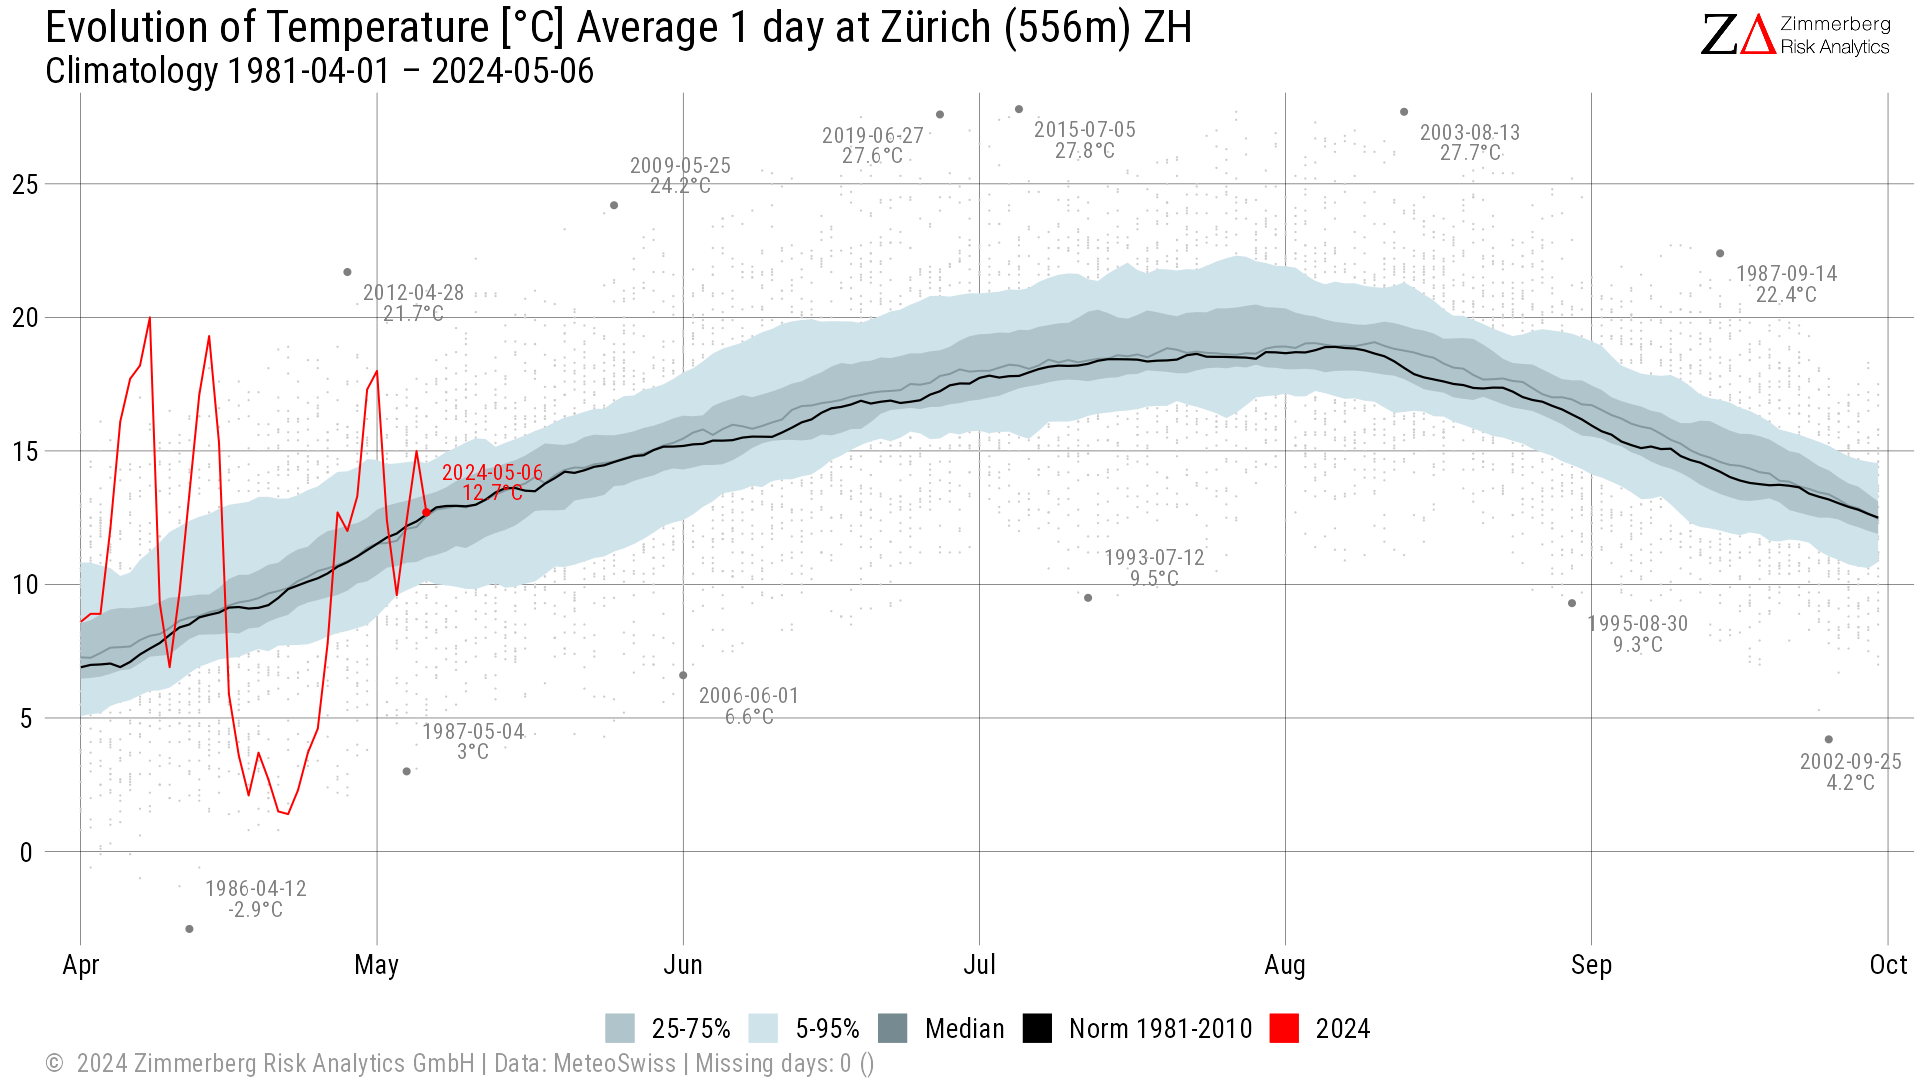
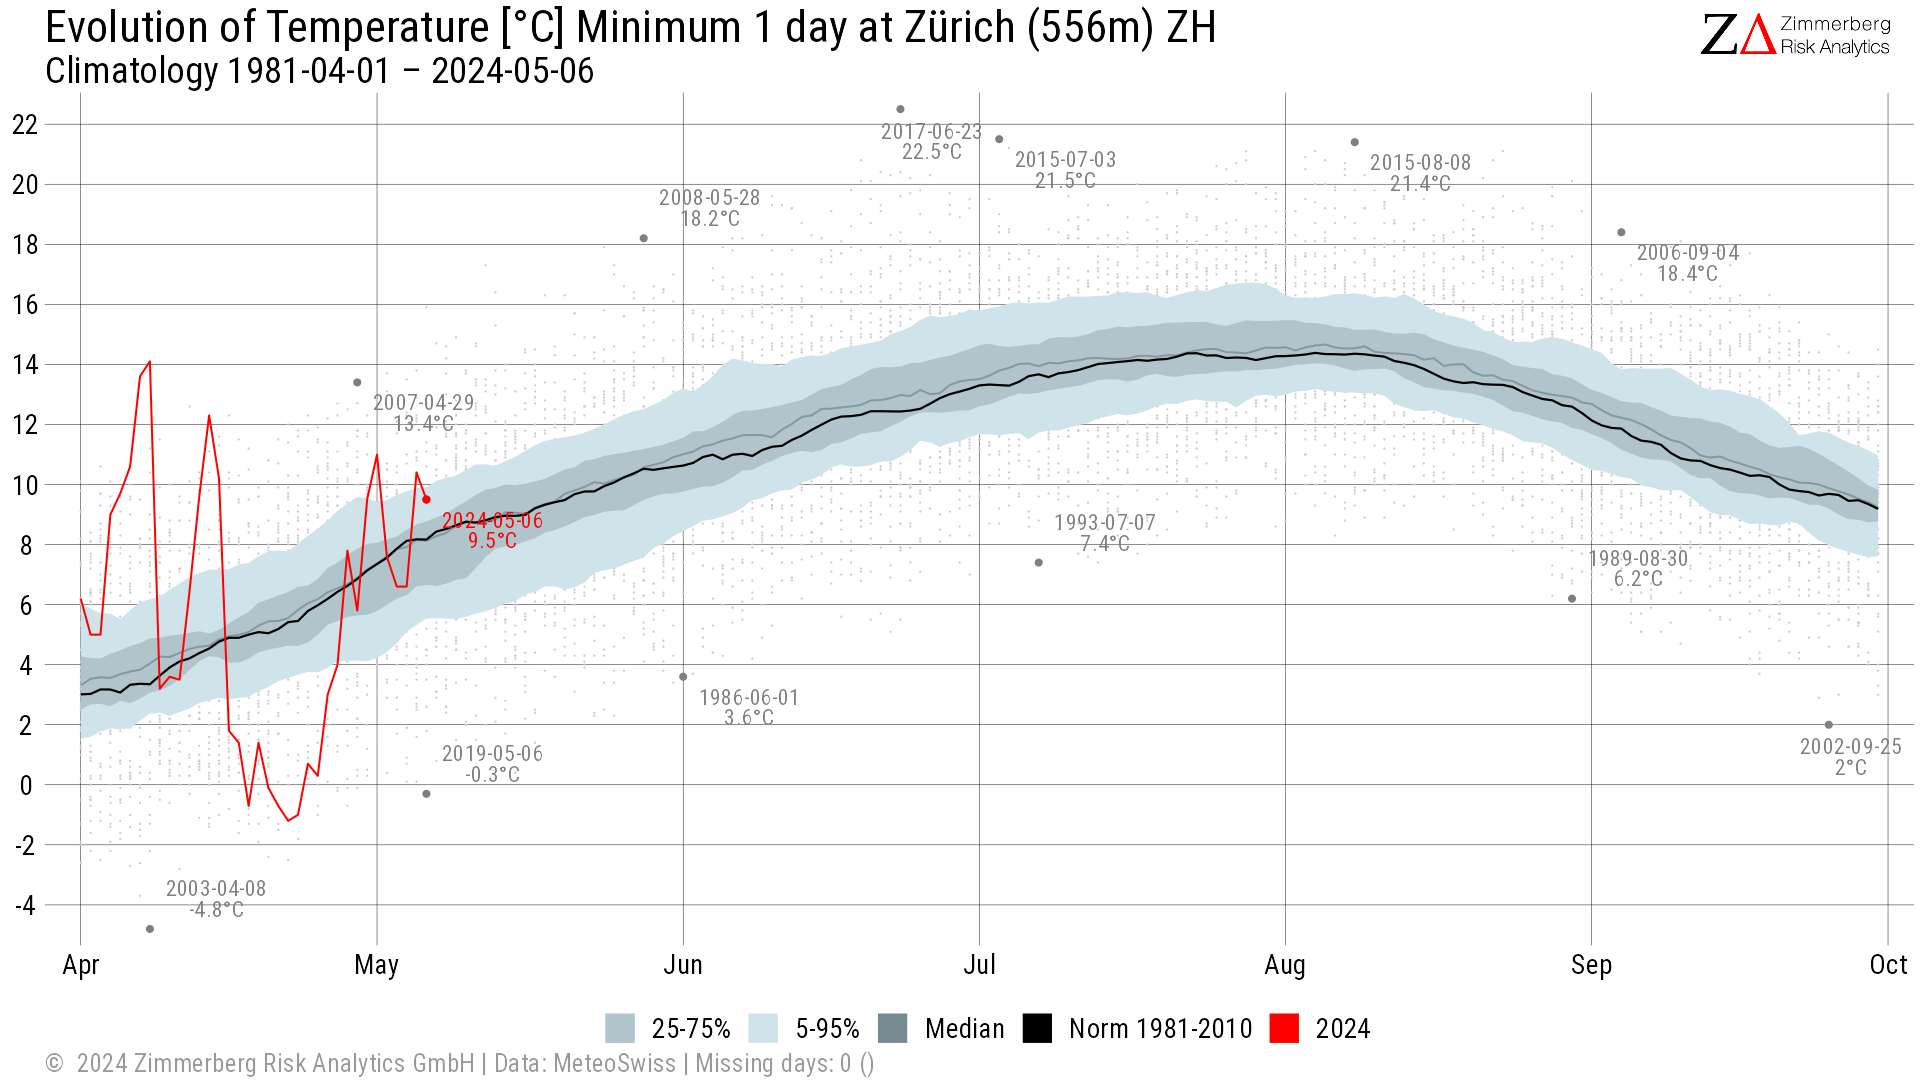
Anomalies (departure from 1981-2010 climate normal)
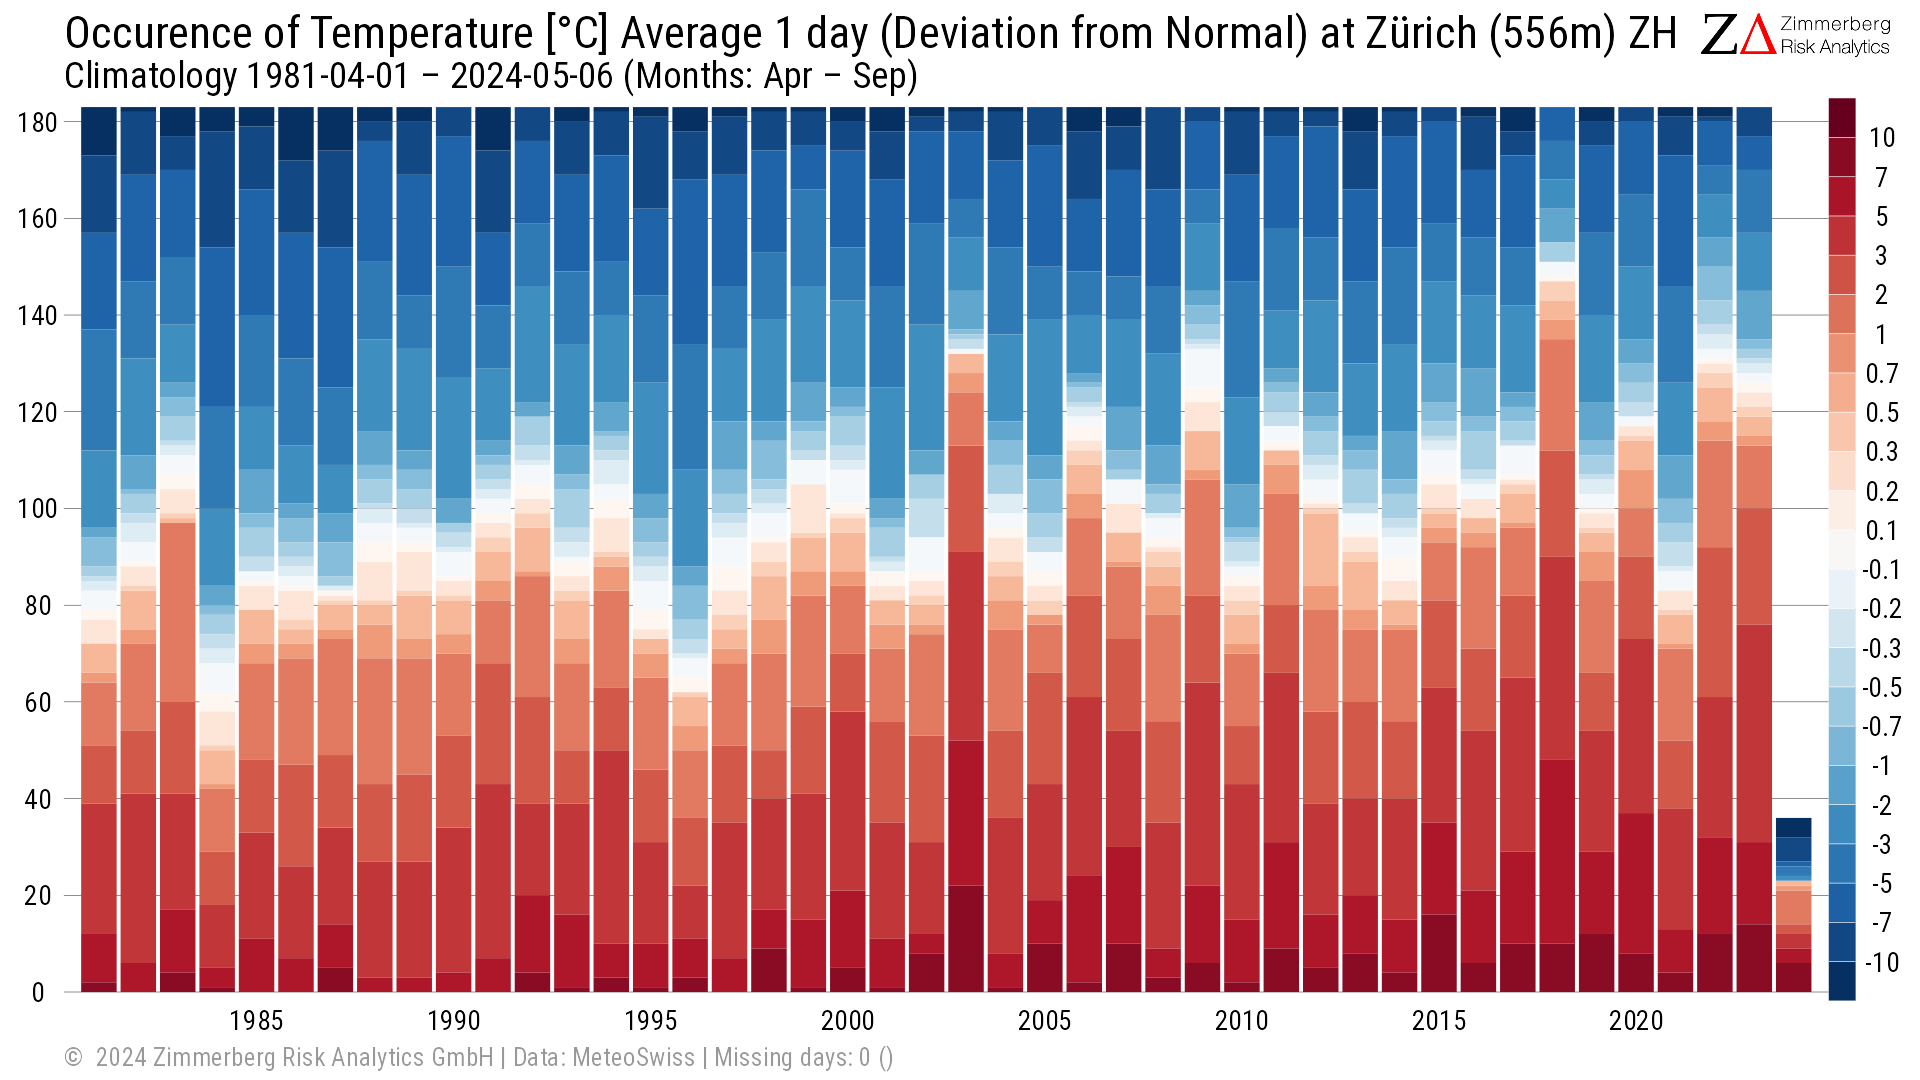
Running average summer season
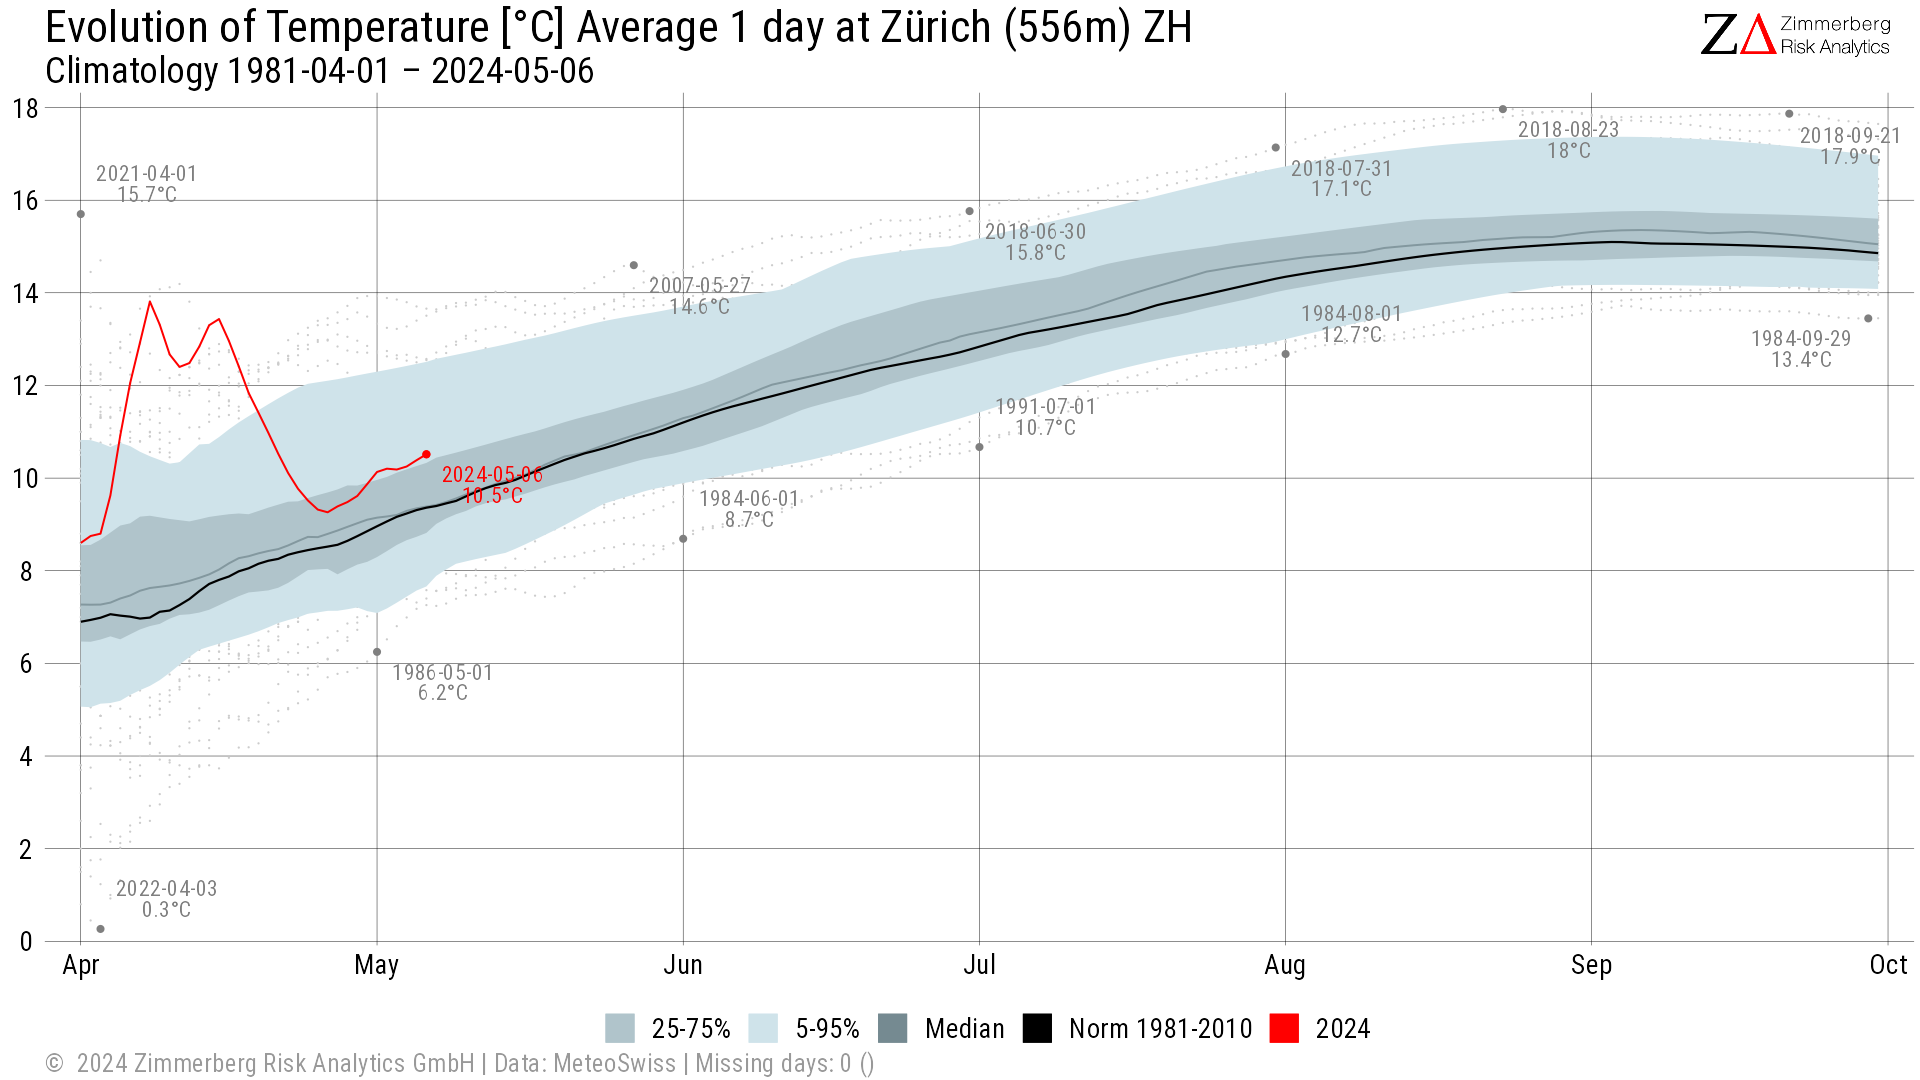
More charts:
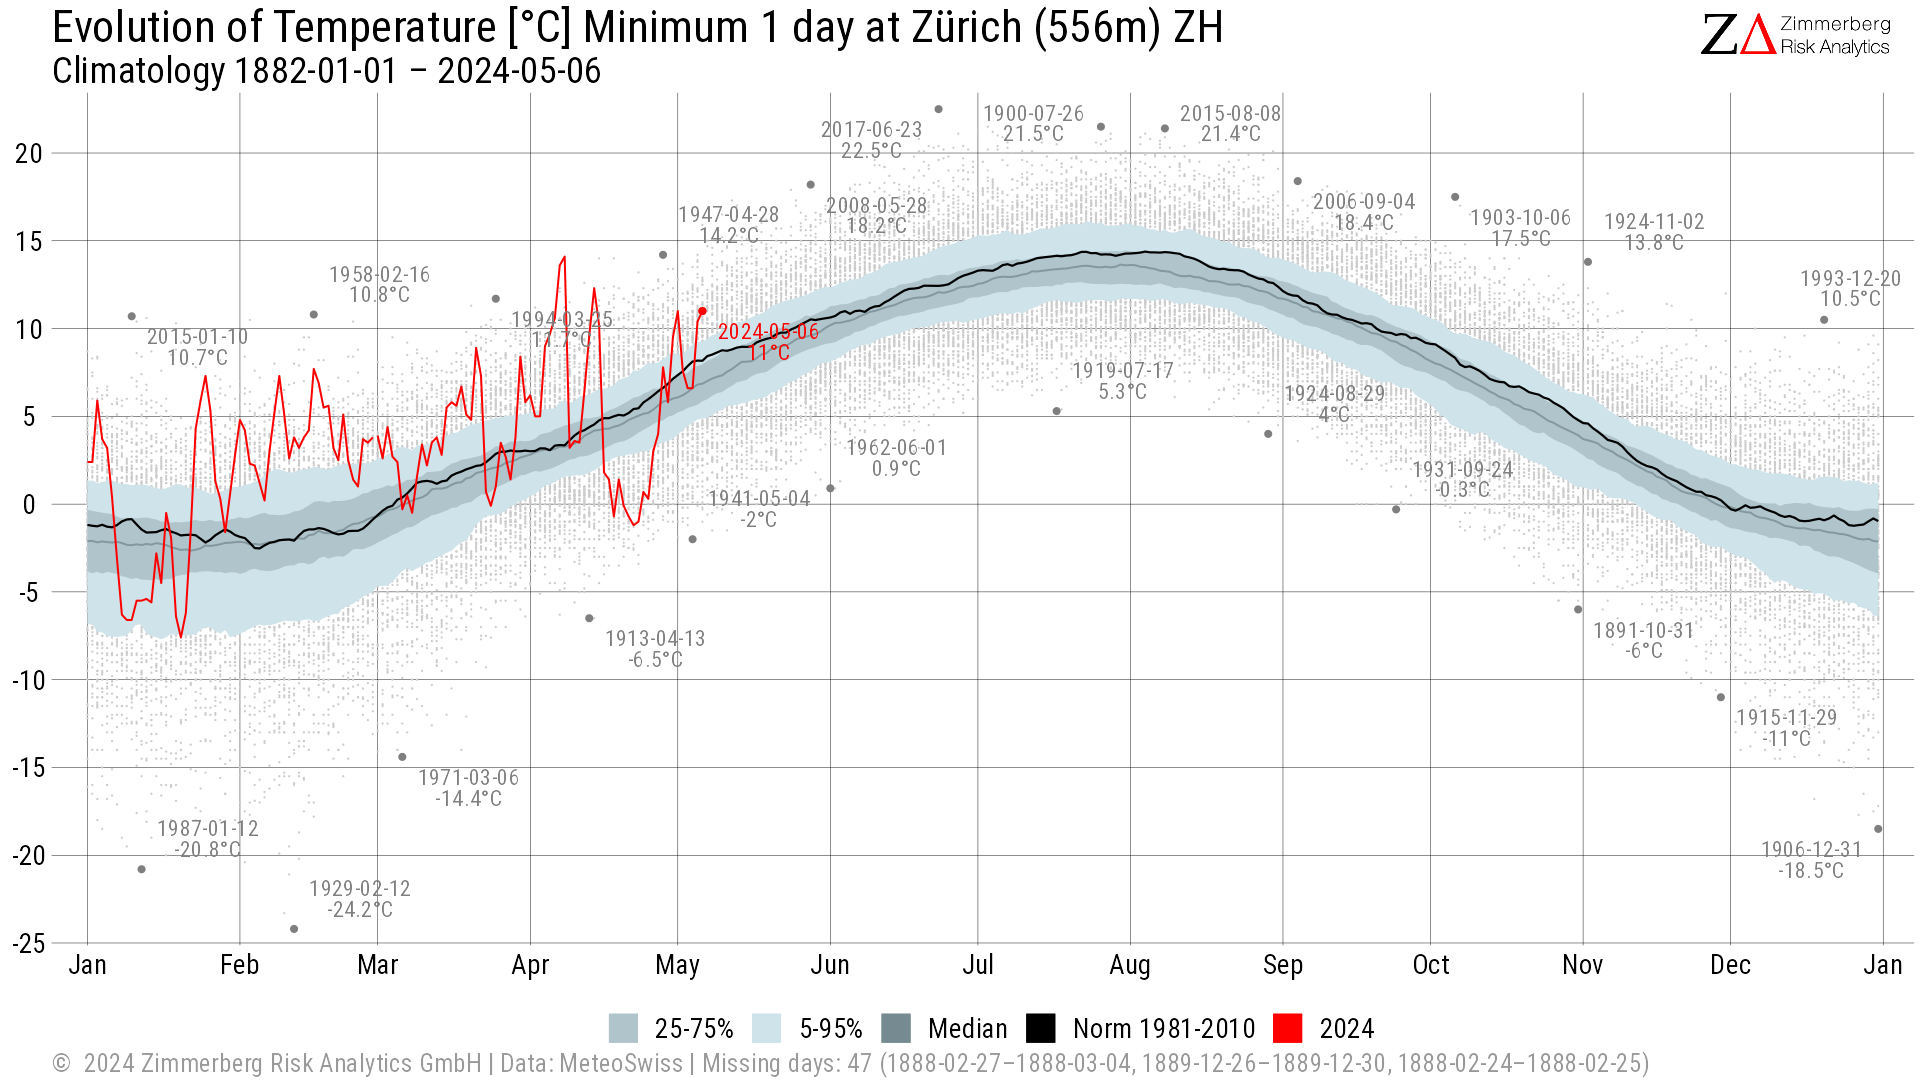
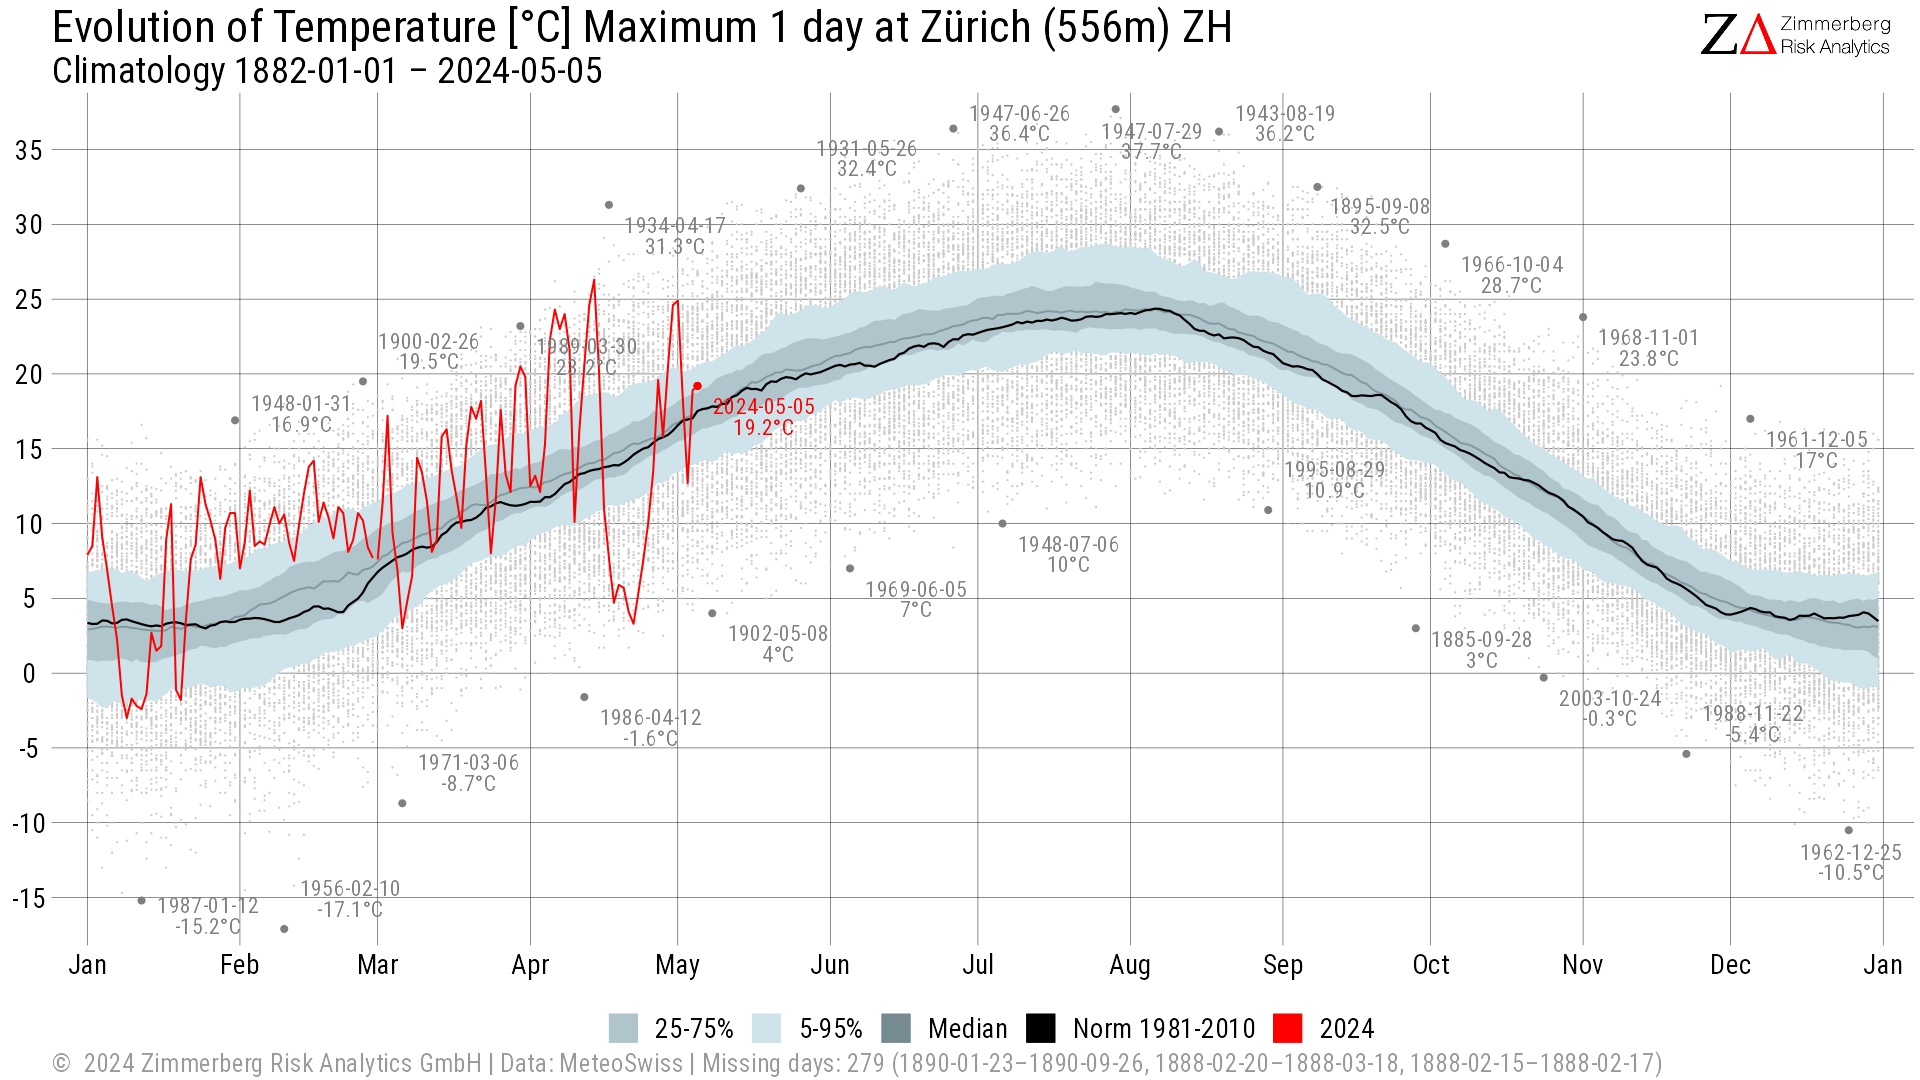
Indices
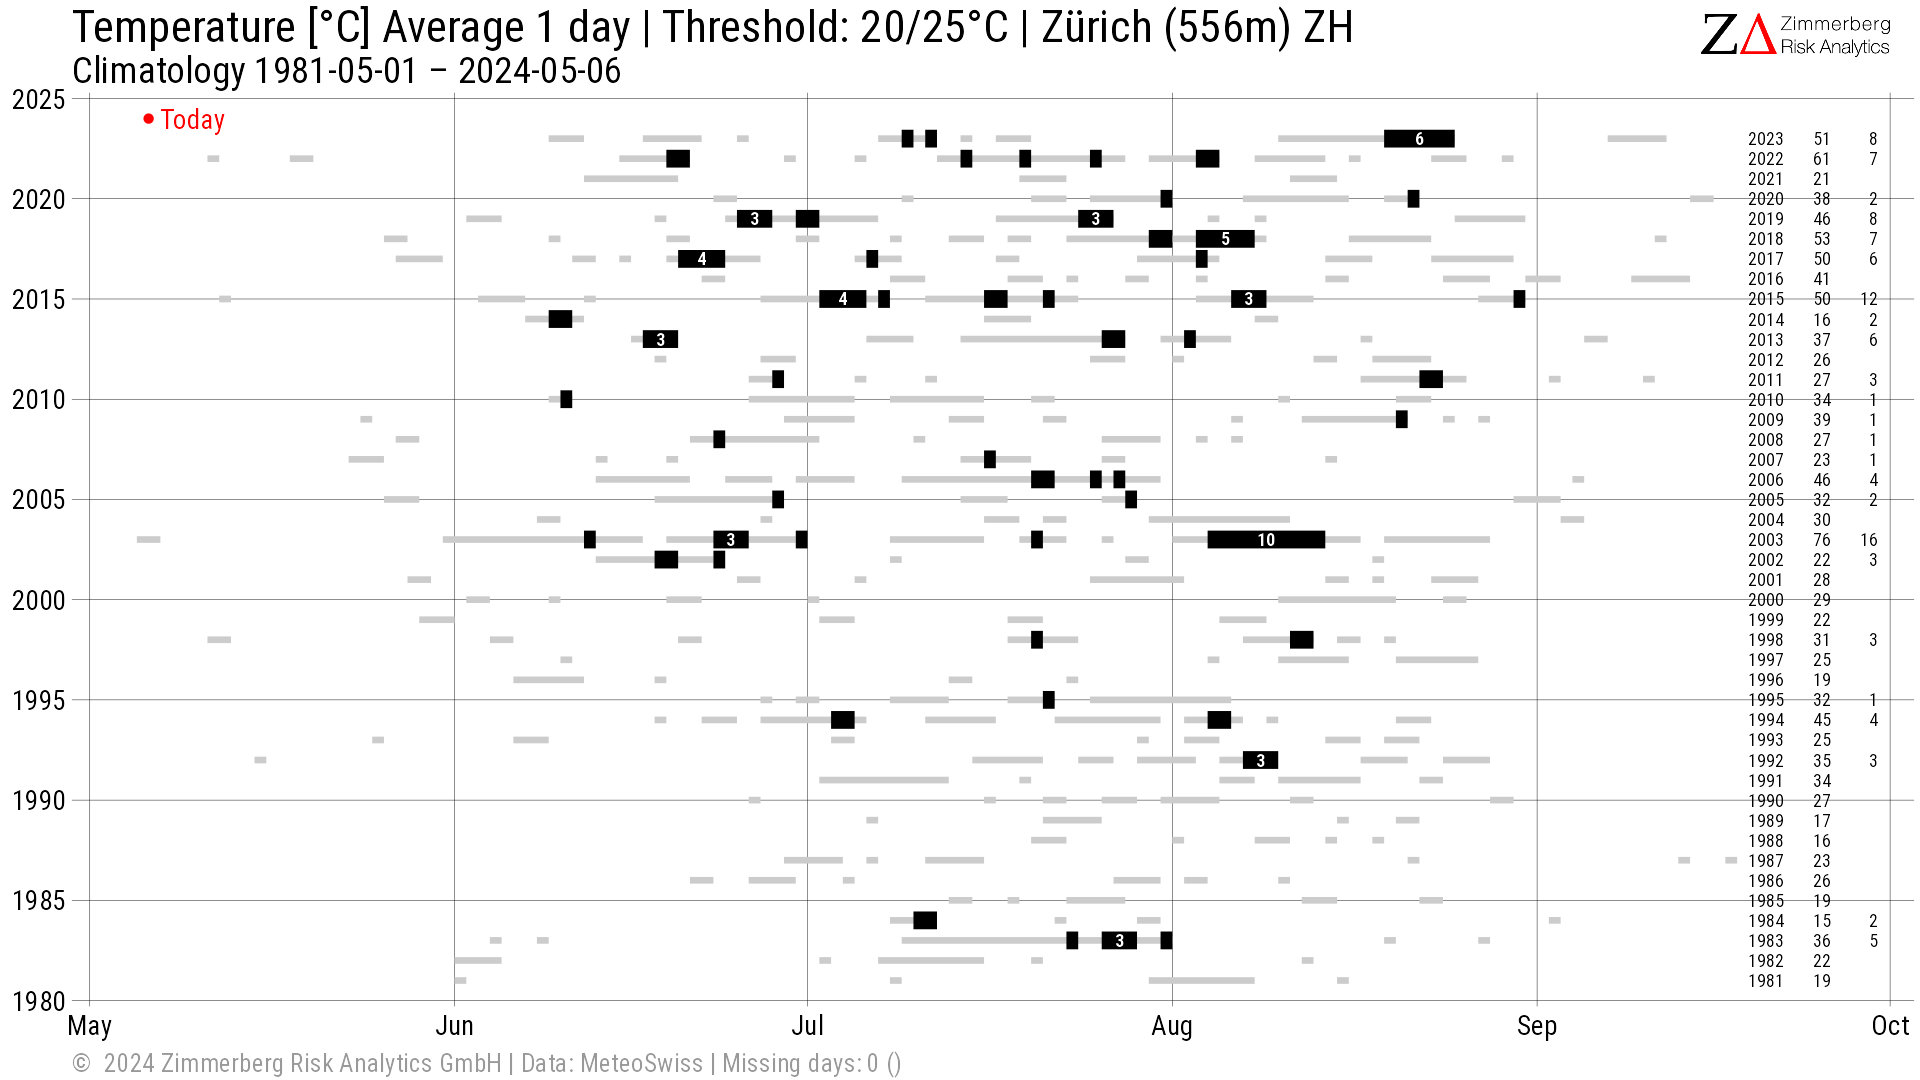
Warm/Heat Periods (Daily Average Temperature)
Note that the temperature thresholds used to the determine warm/heat periods depend on station altitude.
Warm/Heat Periods (Daily Max Temperature)
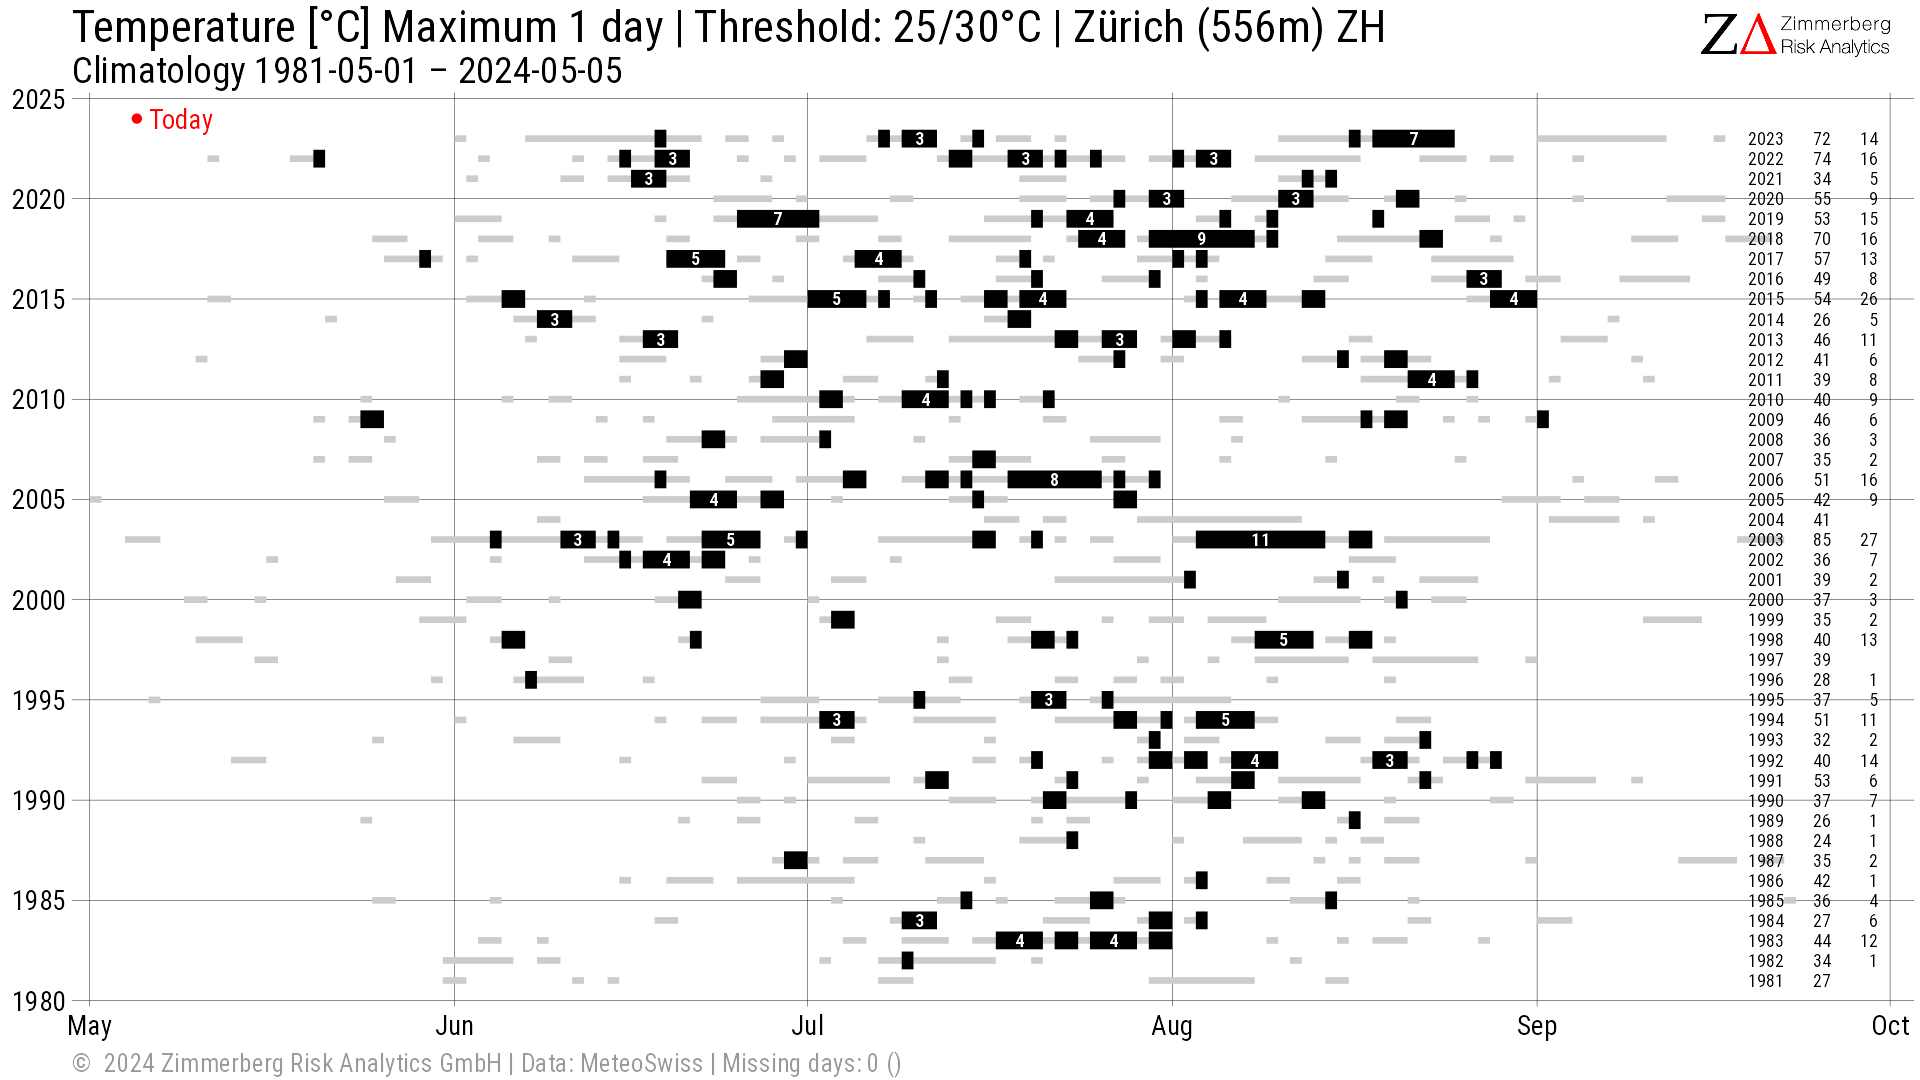
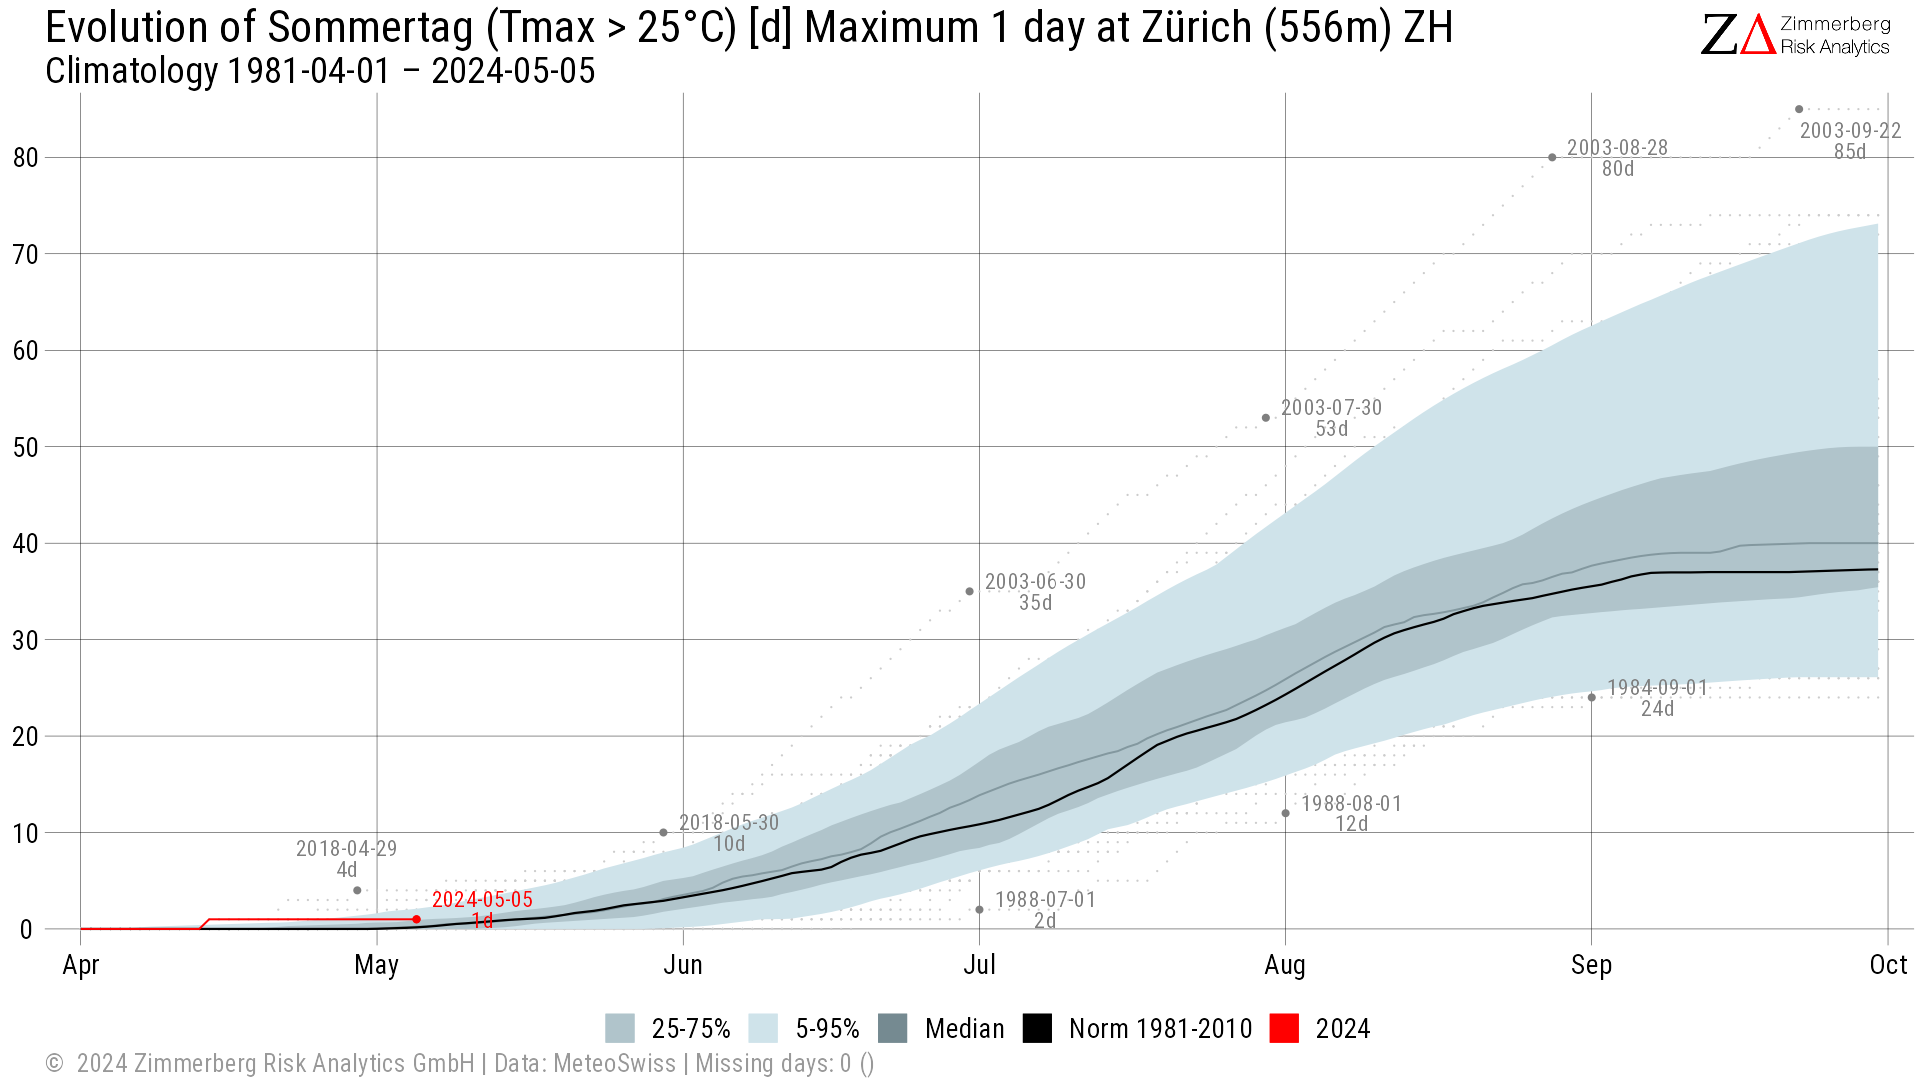
Sommertag
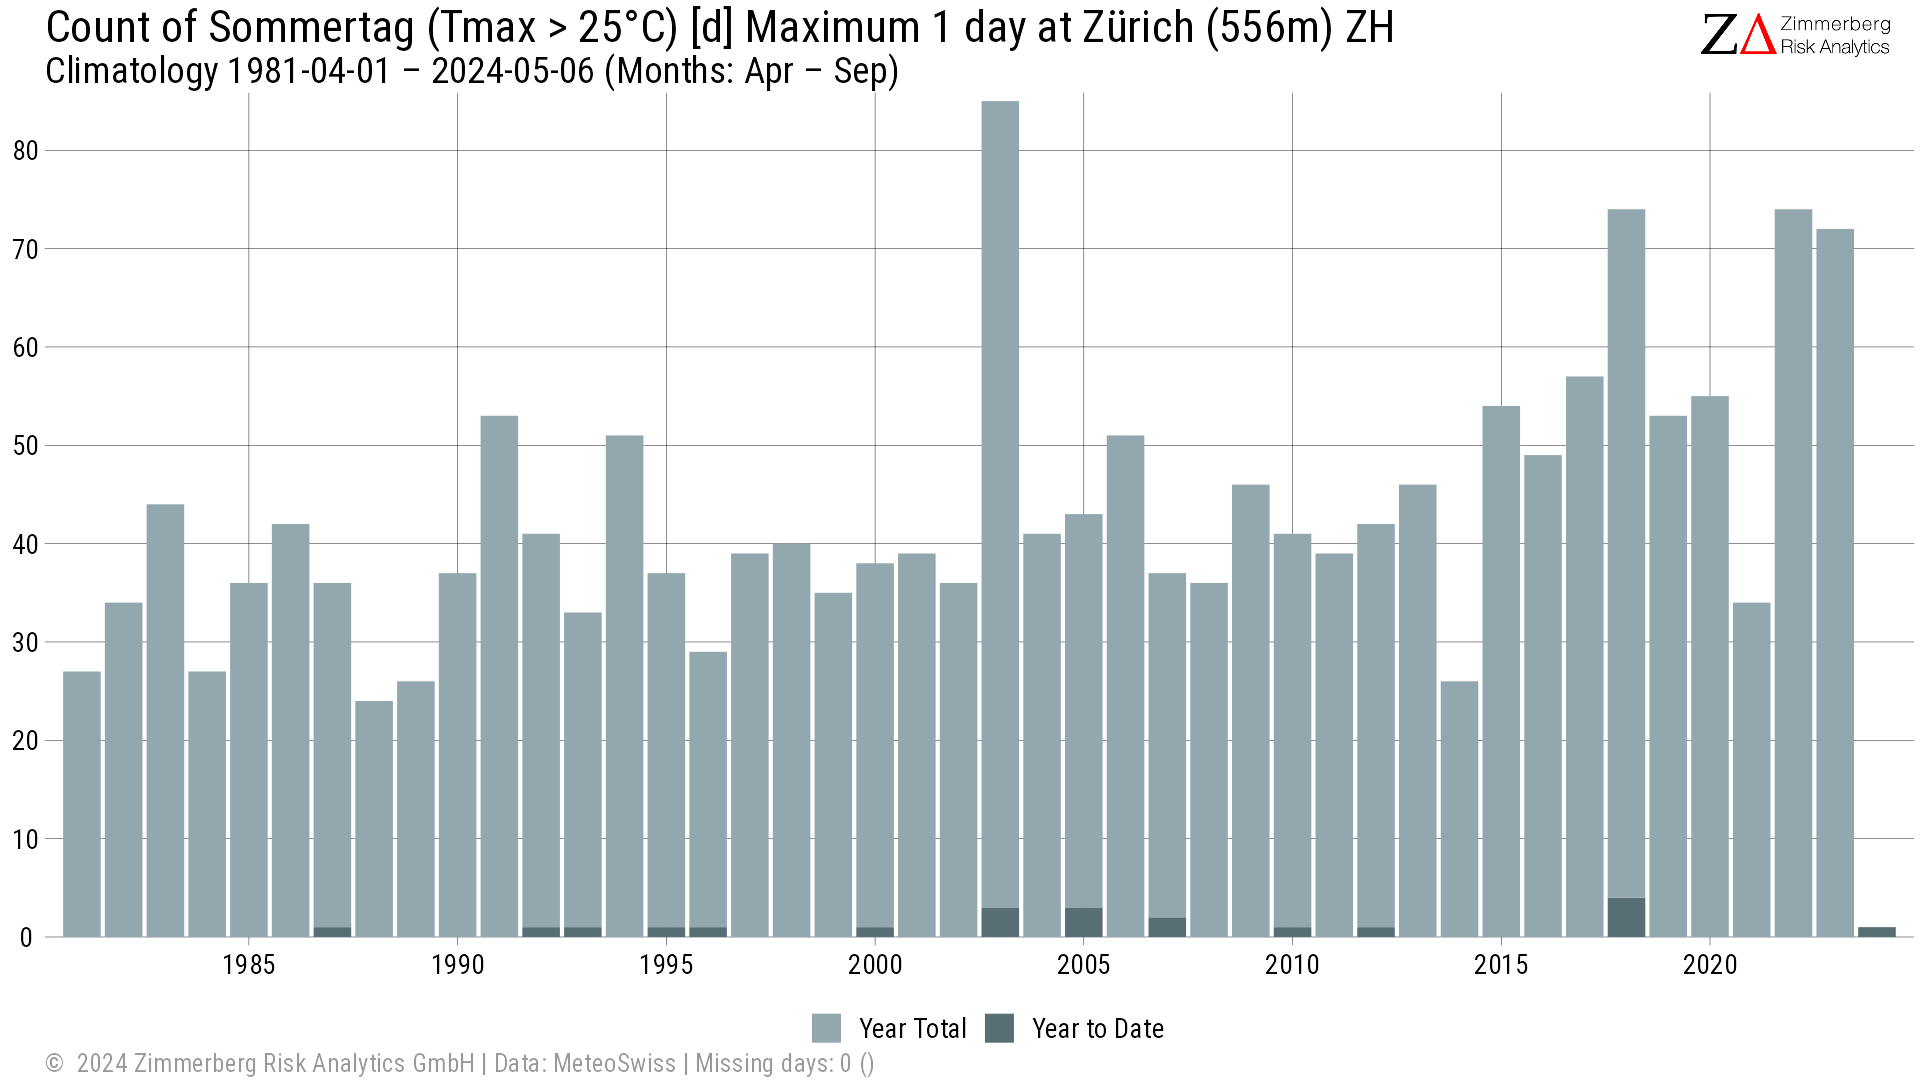
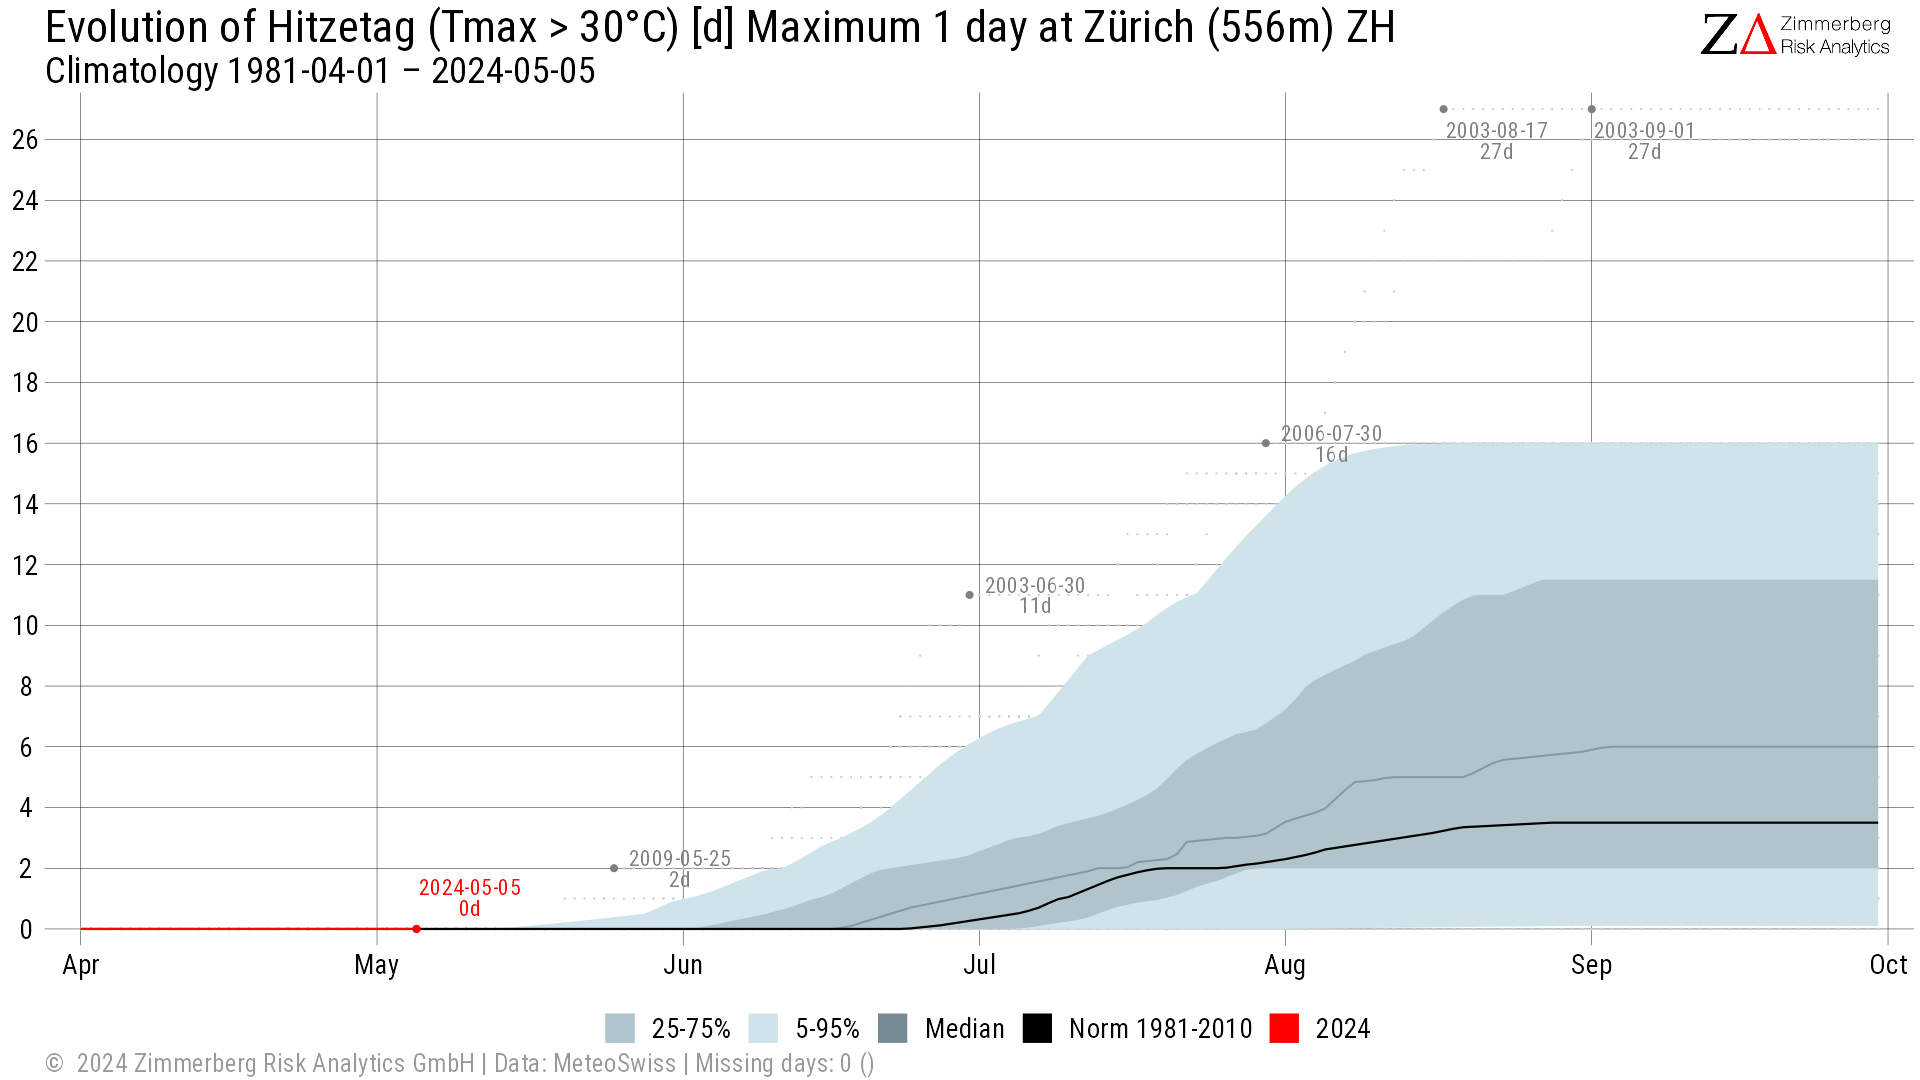
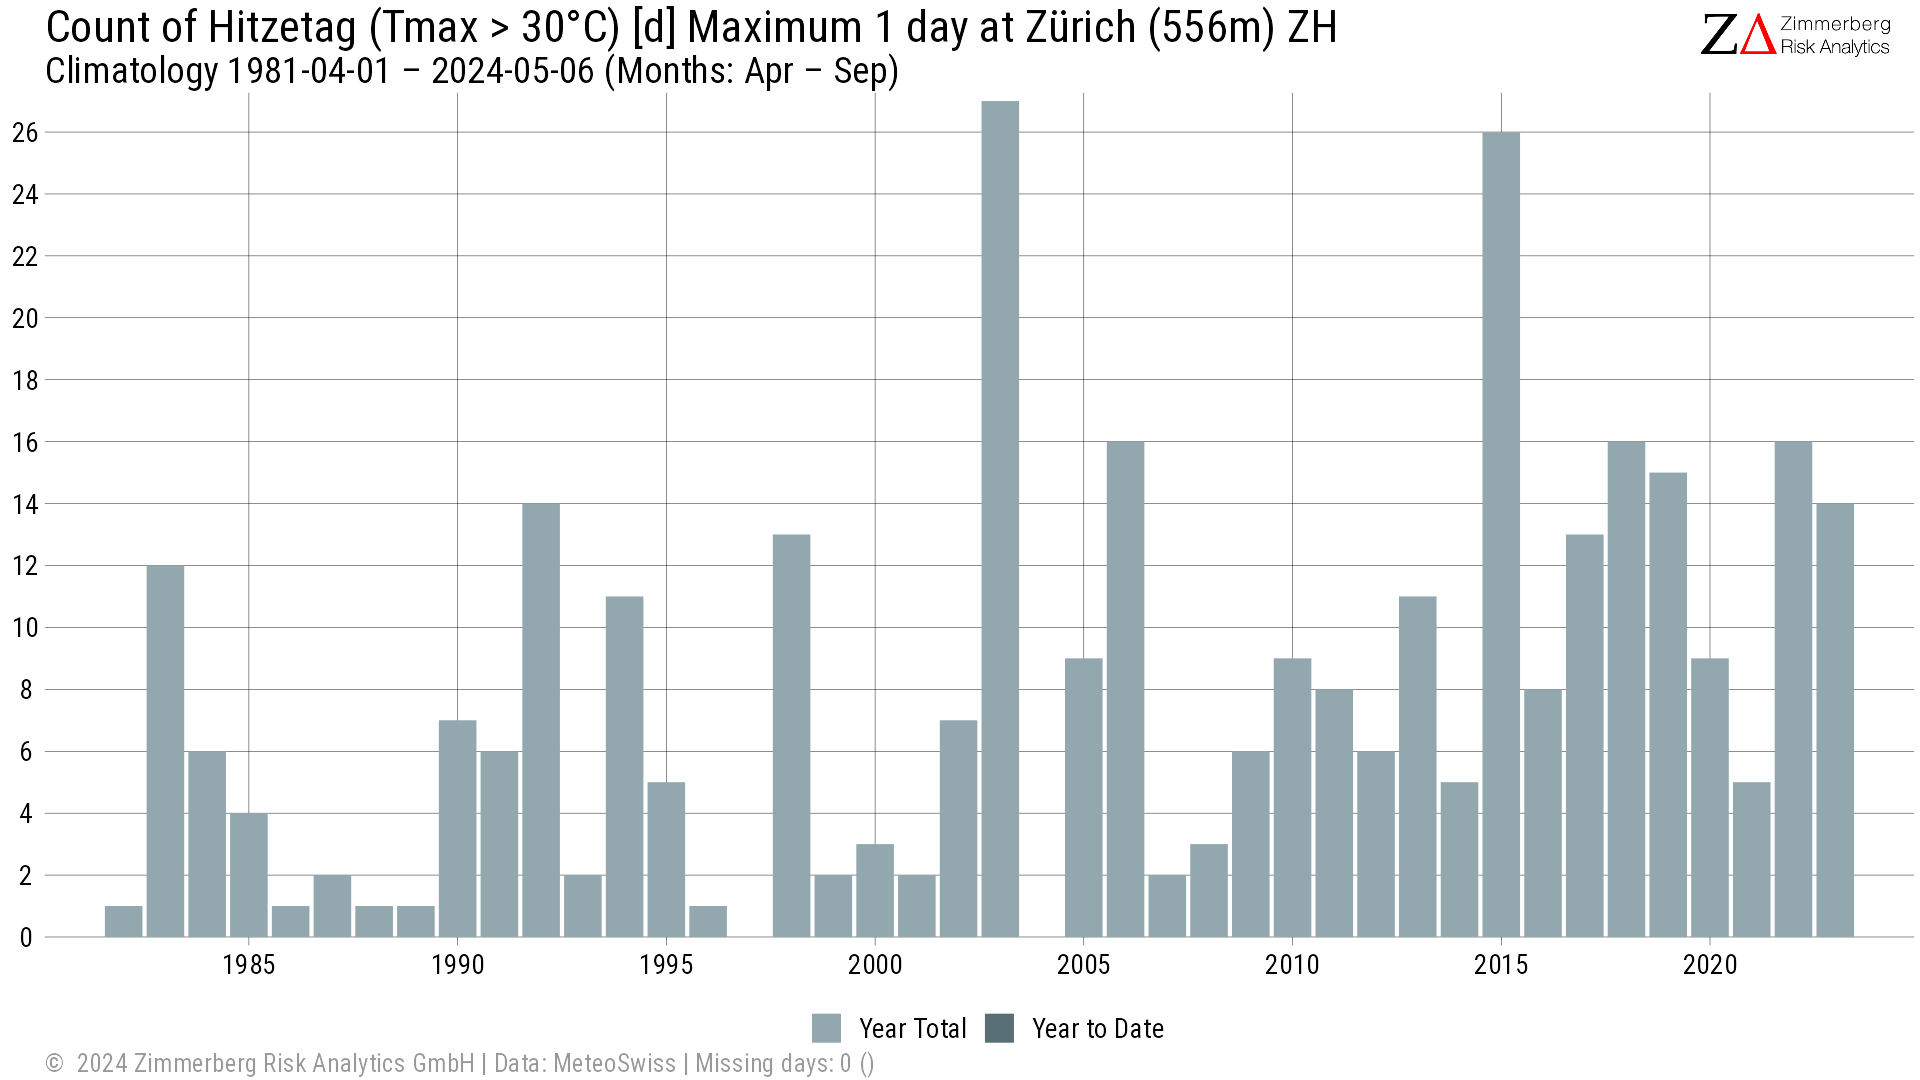
Hitzetag
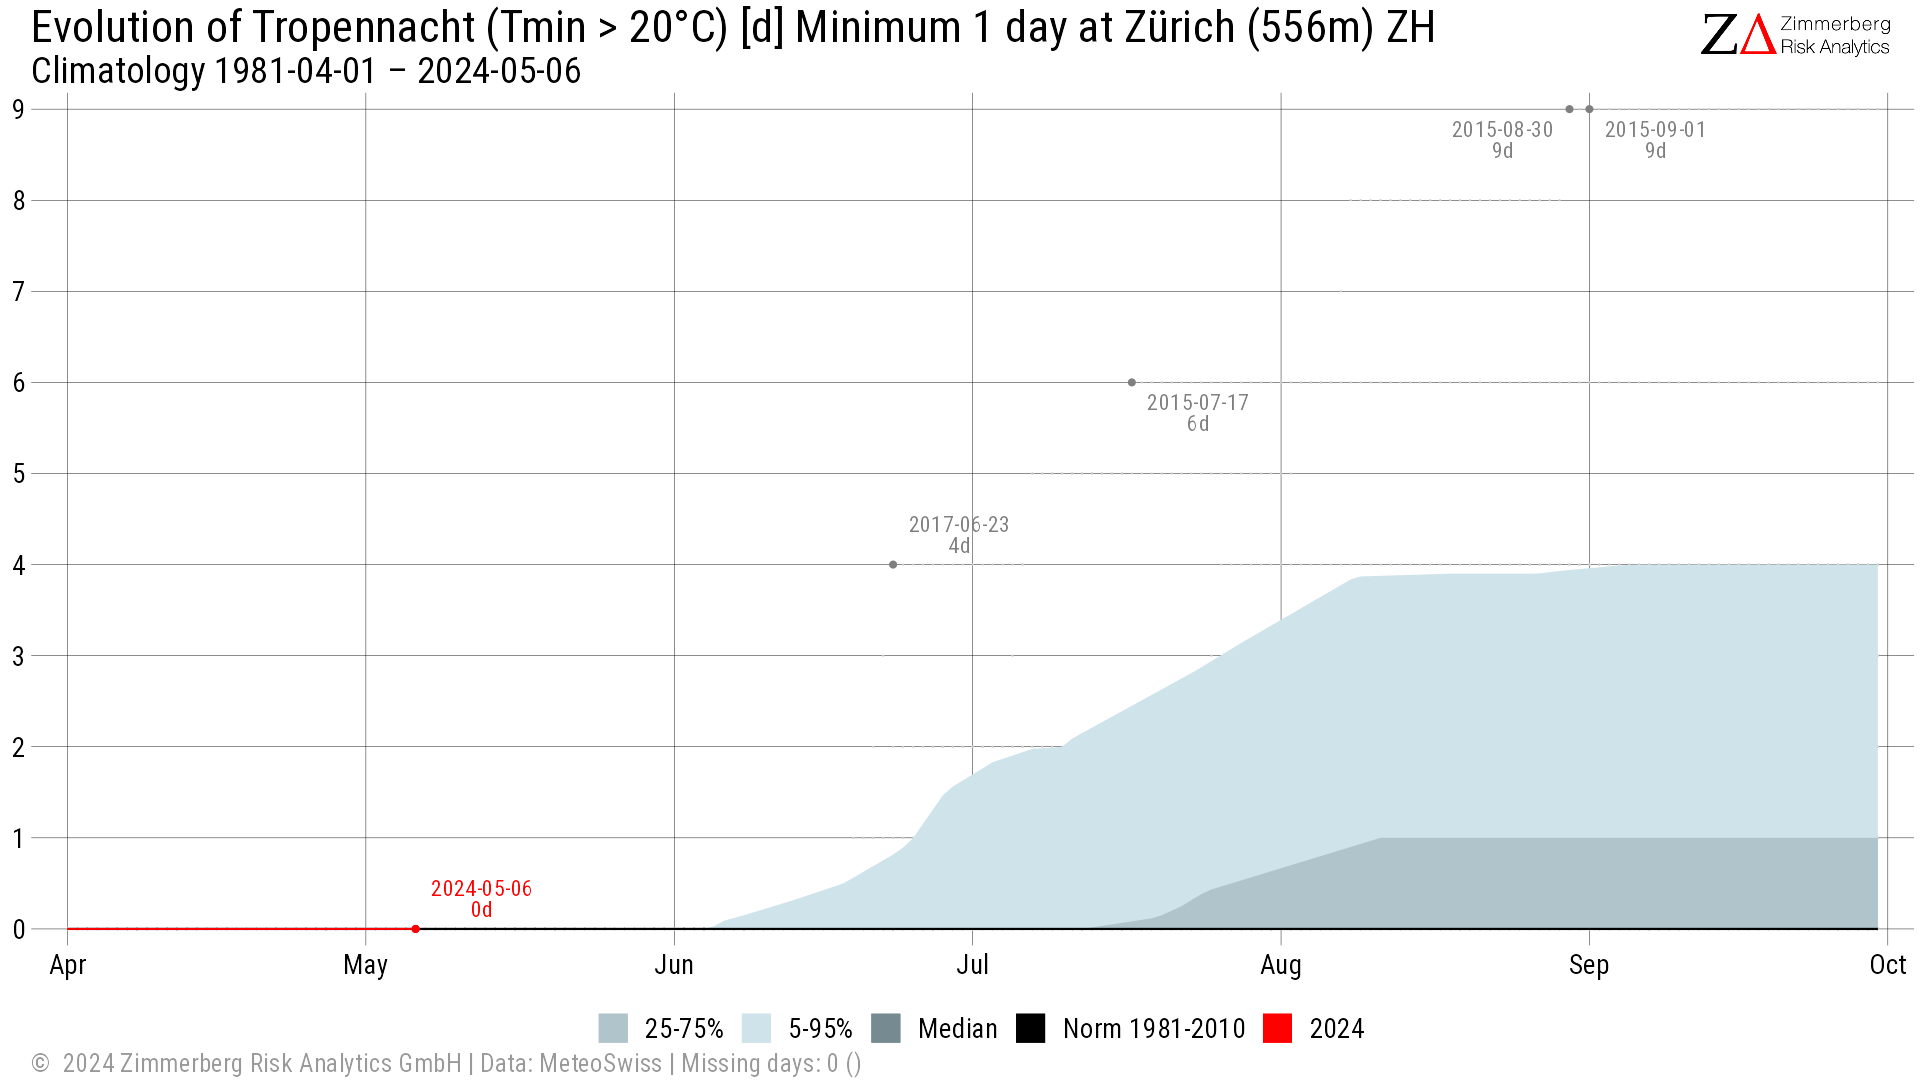
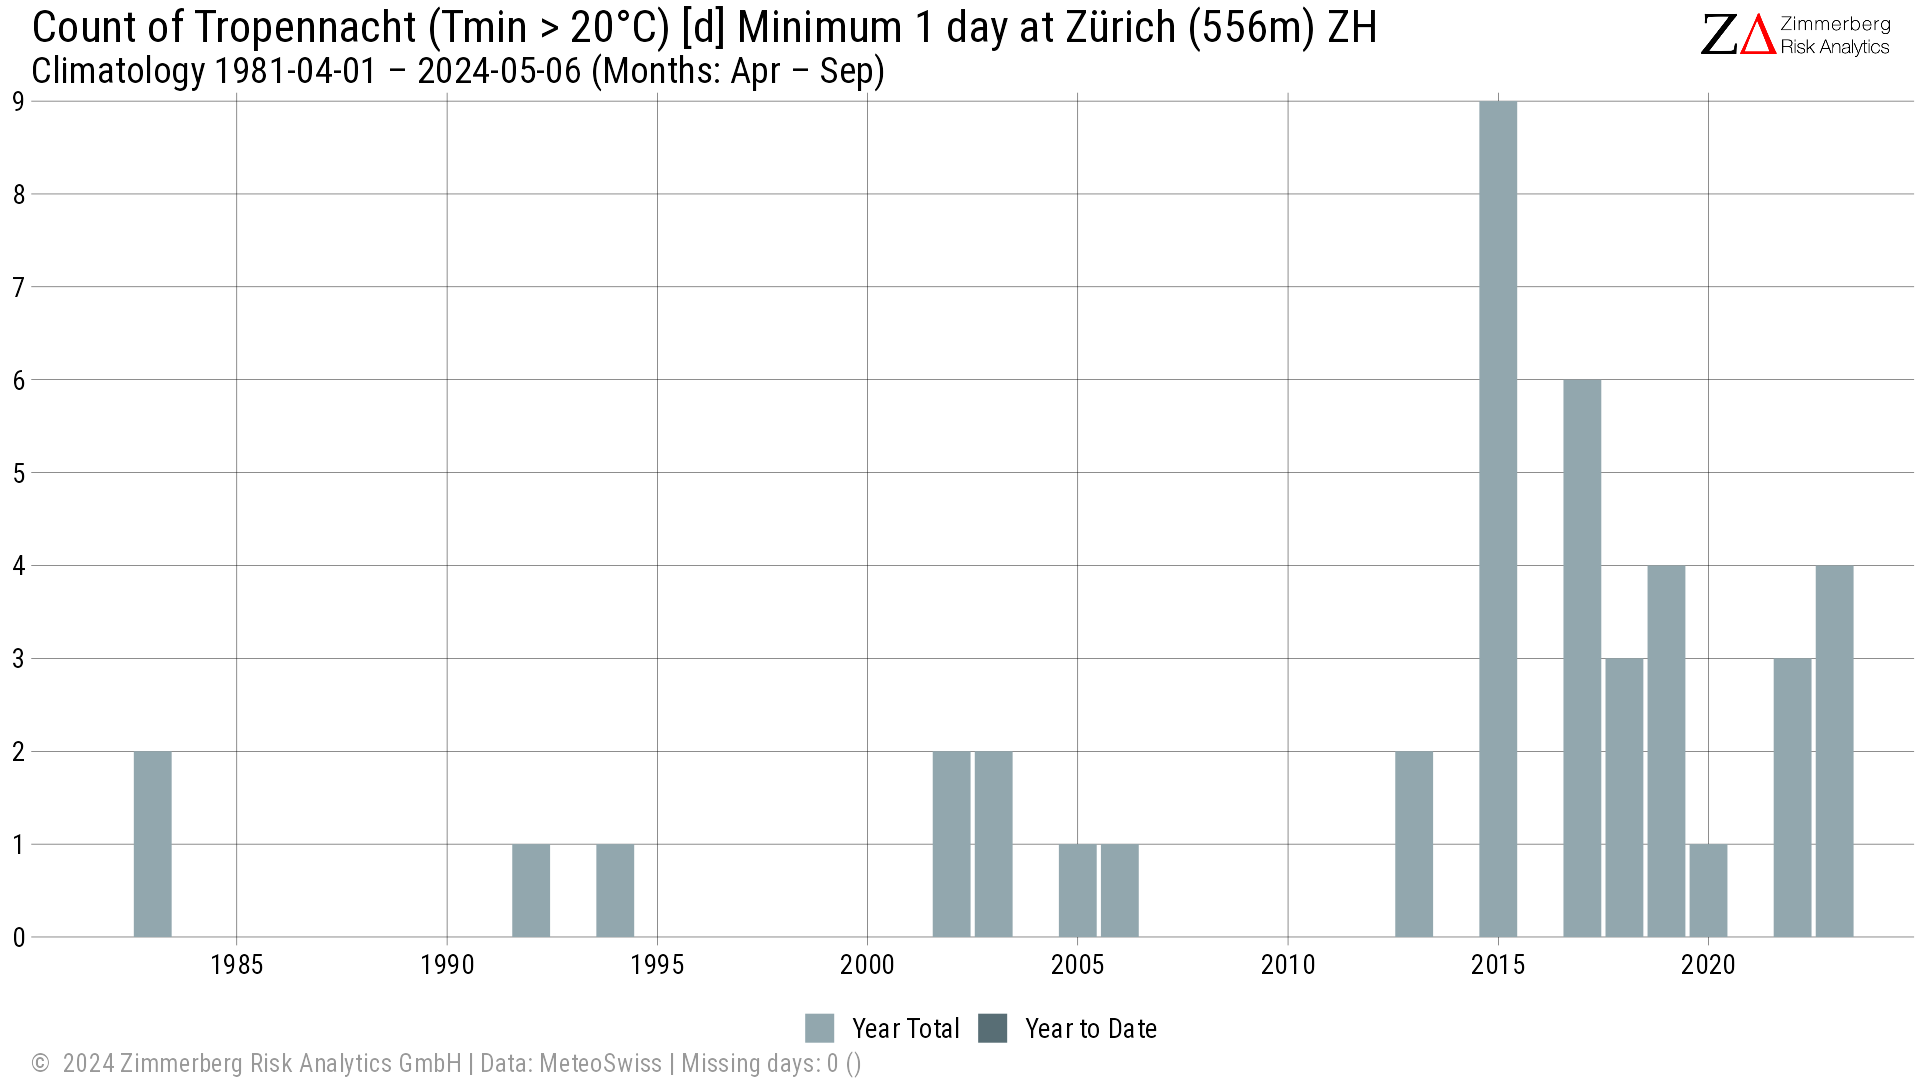
Tropennacht
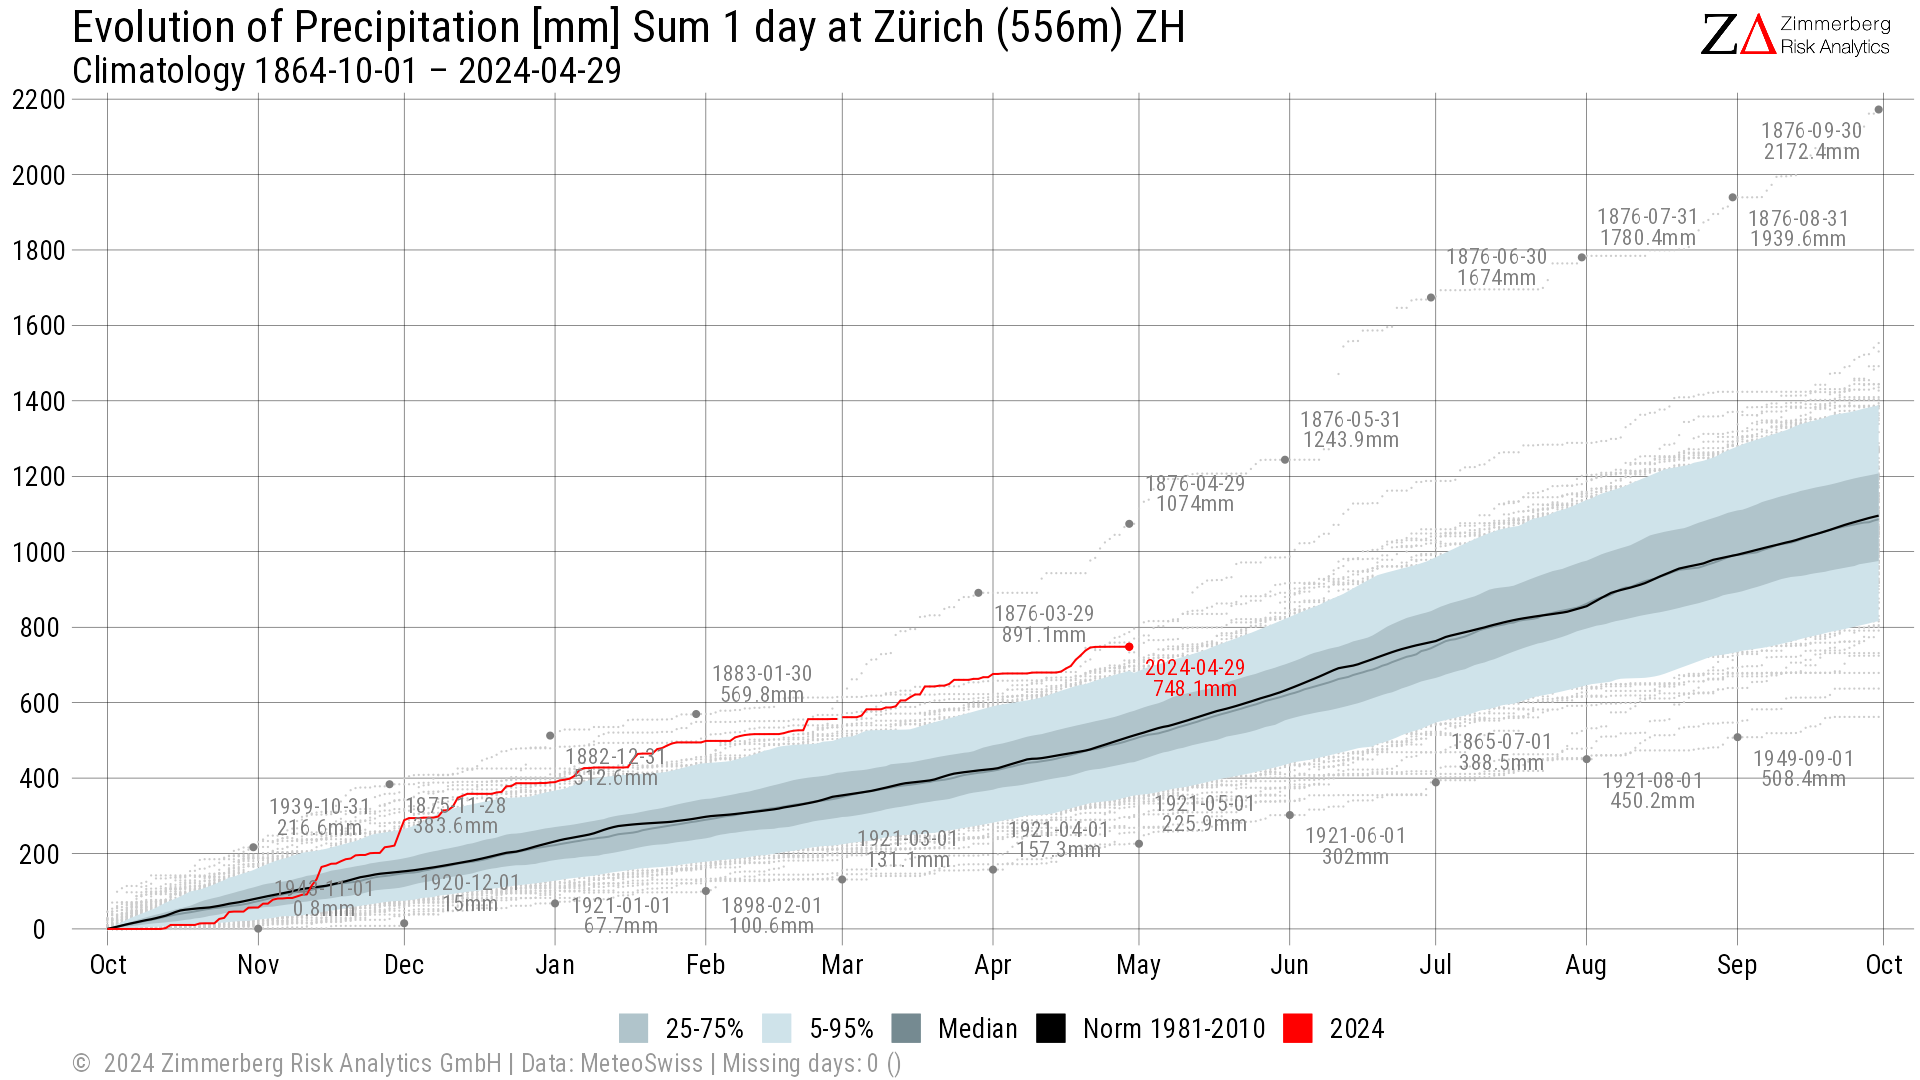
Precipitation (Hydrological Year)
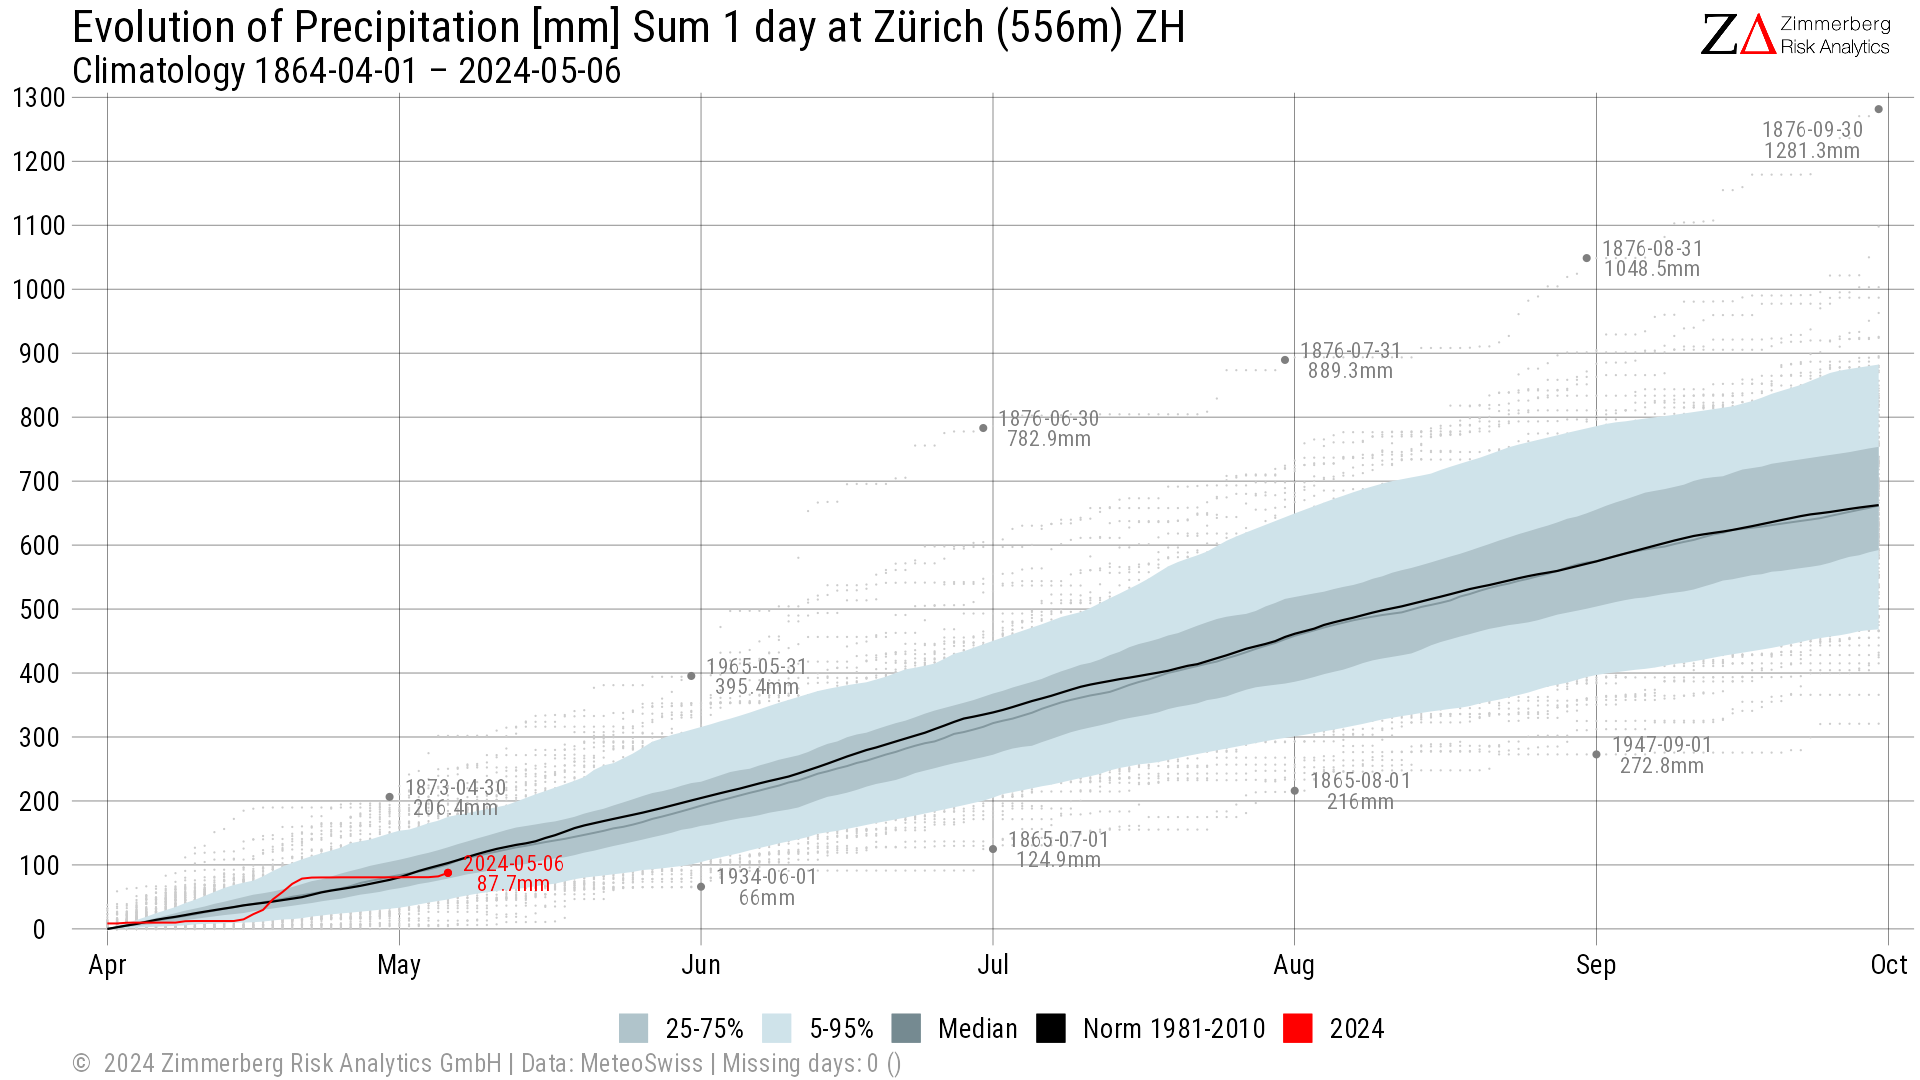
Precipitation (Summer Apr-Sep)
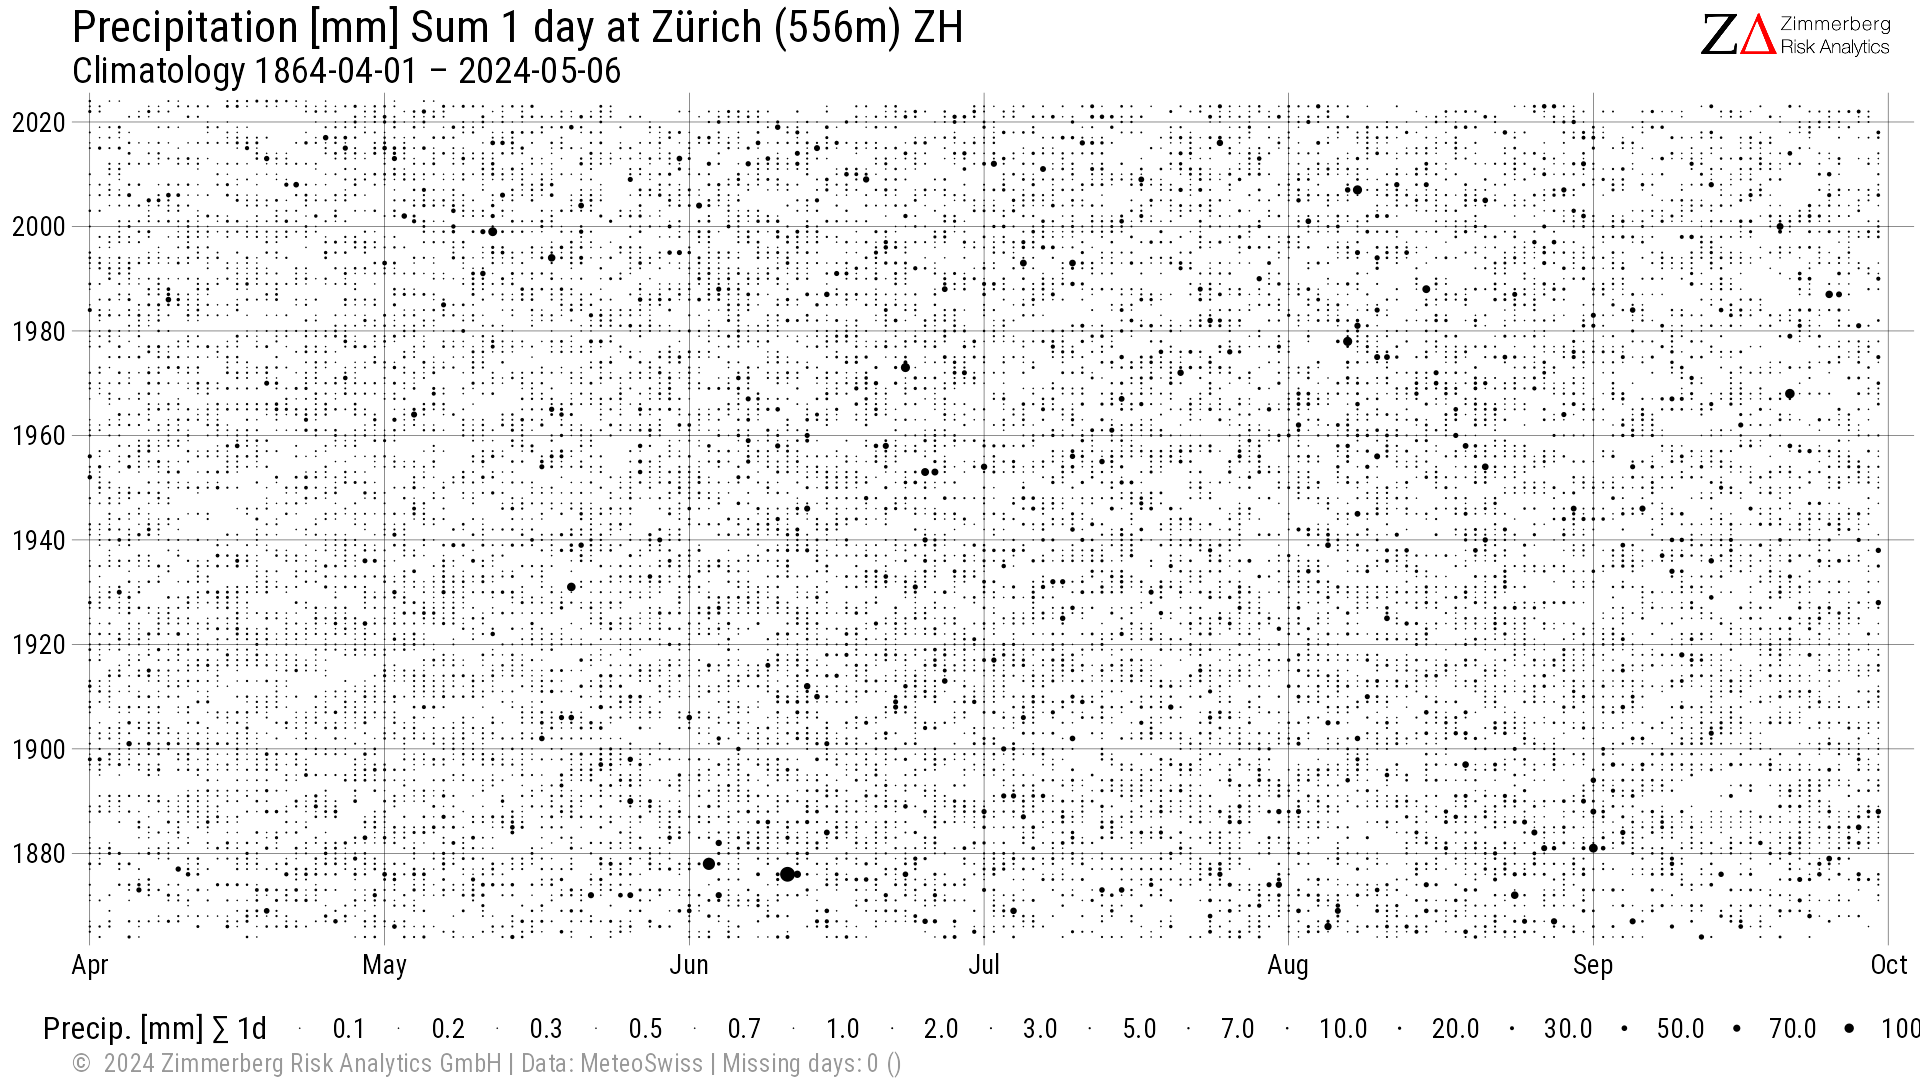
Top Ten Daily Precipitation
| Rank | Year | Date | Value [mm] |
|---|
Highest daily precipitation amount at Zürich ZH (556m).
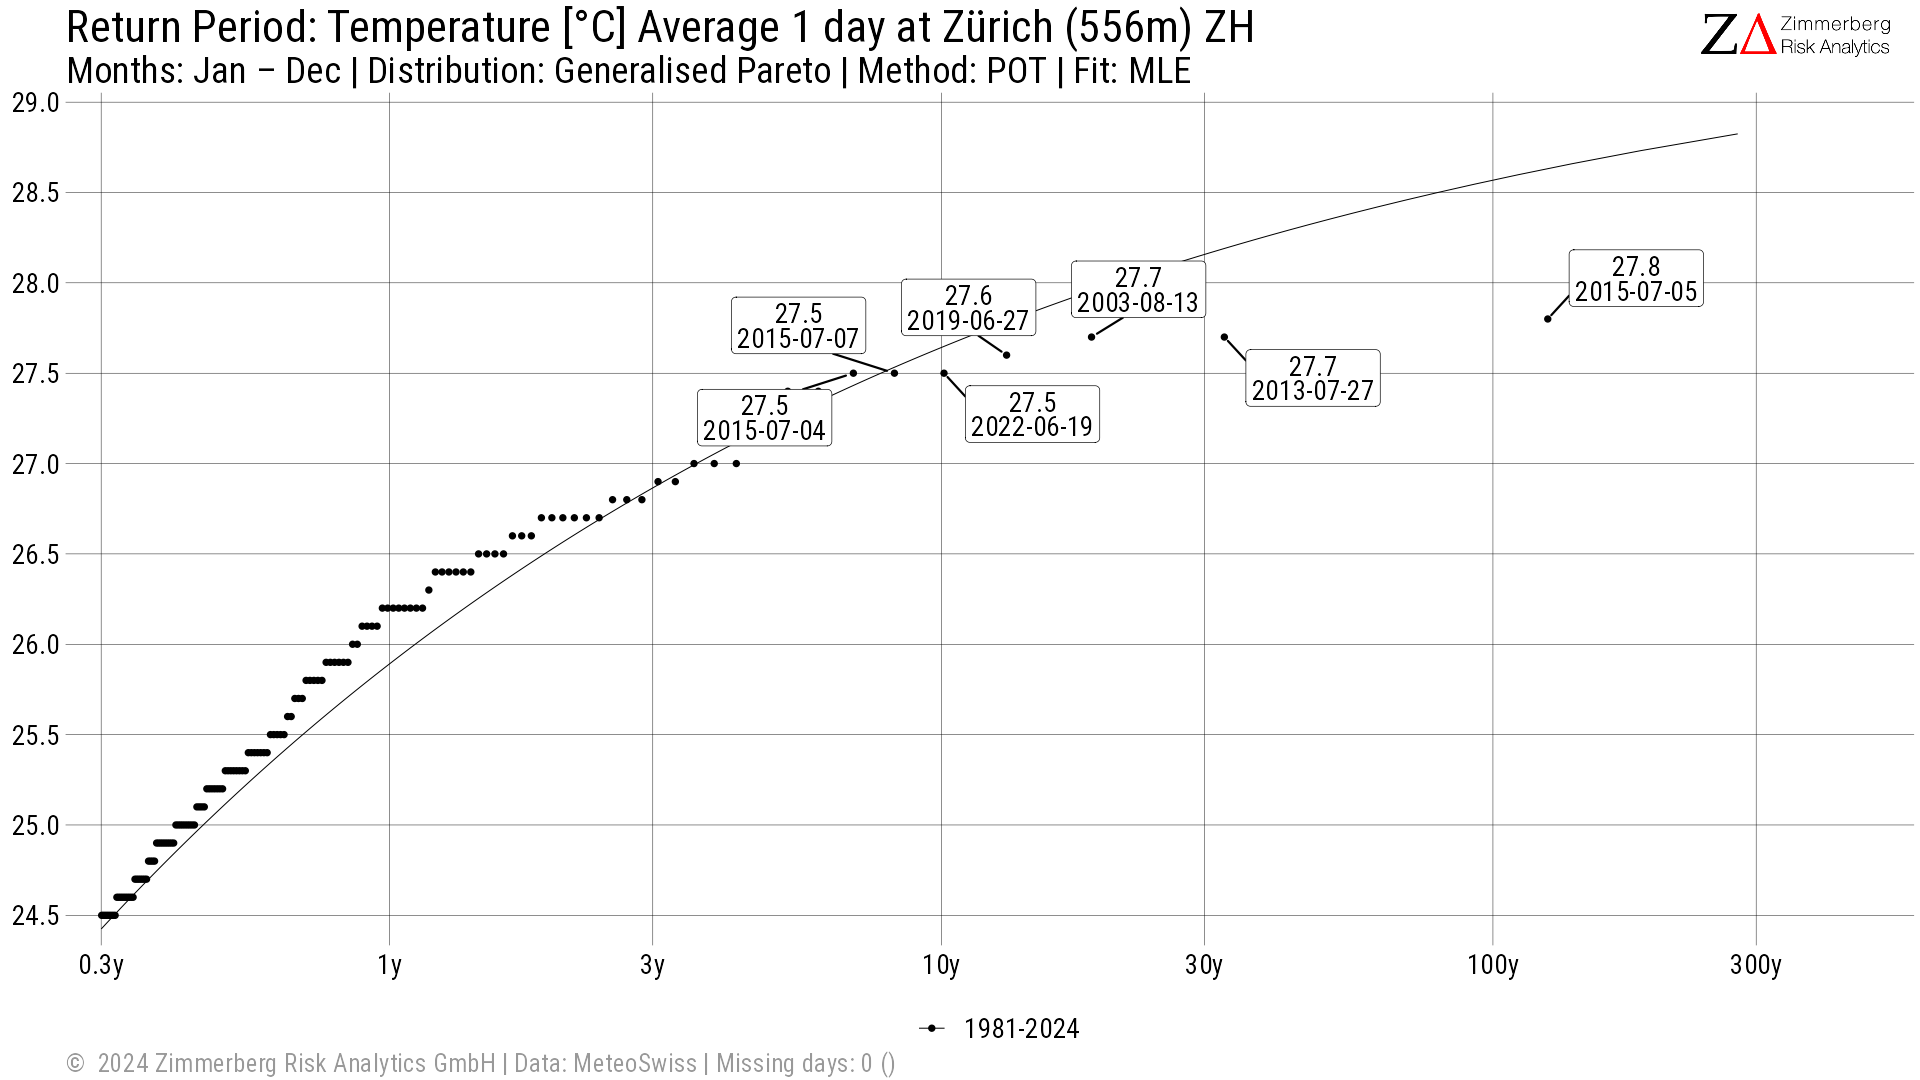
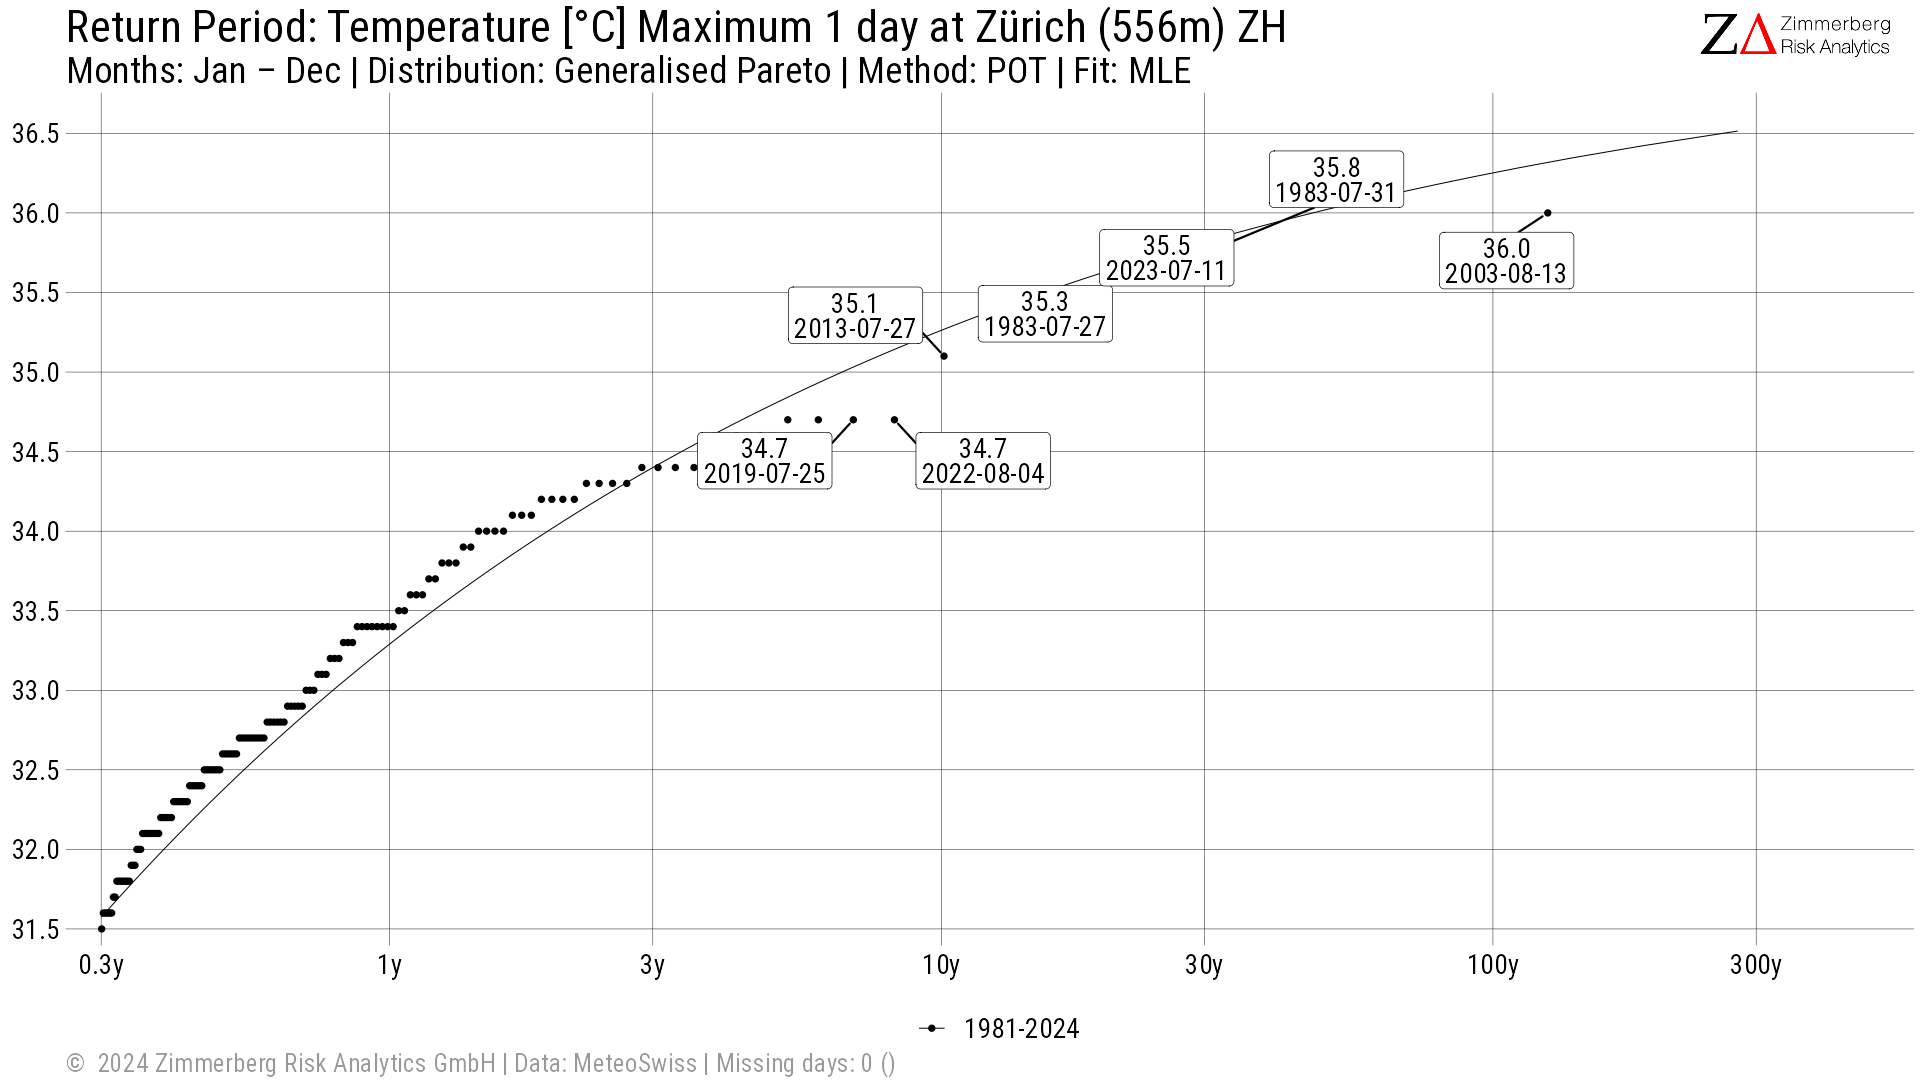
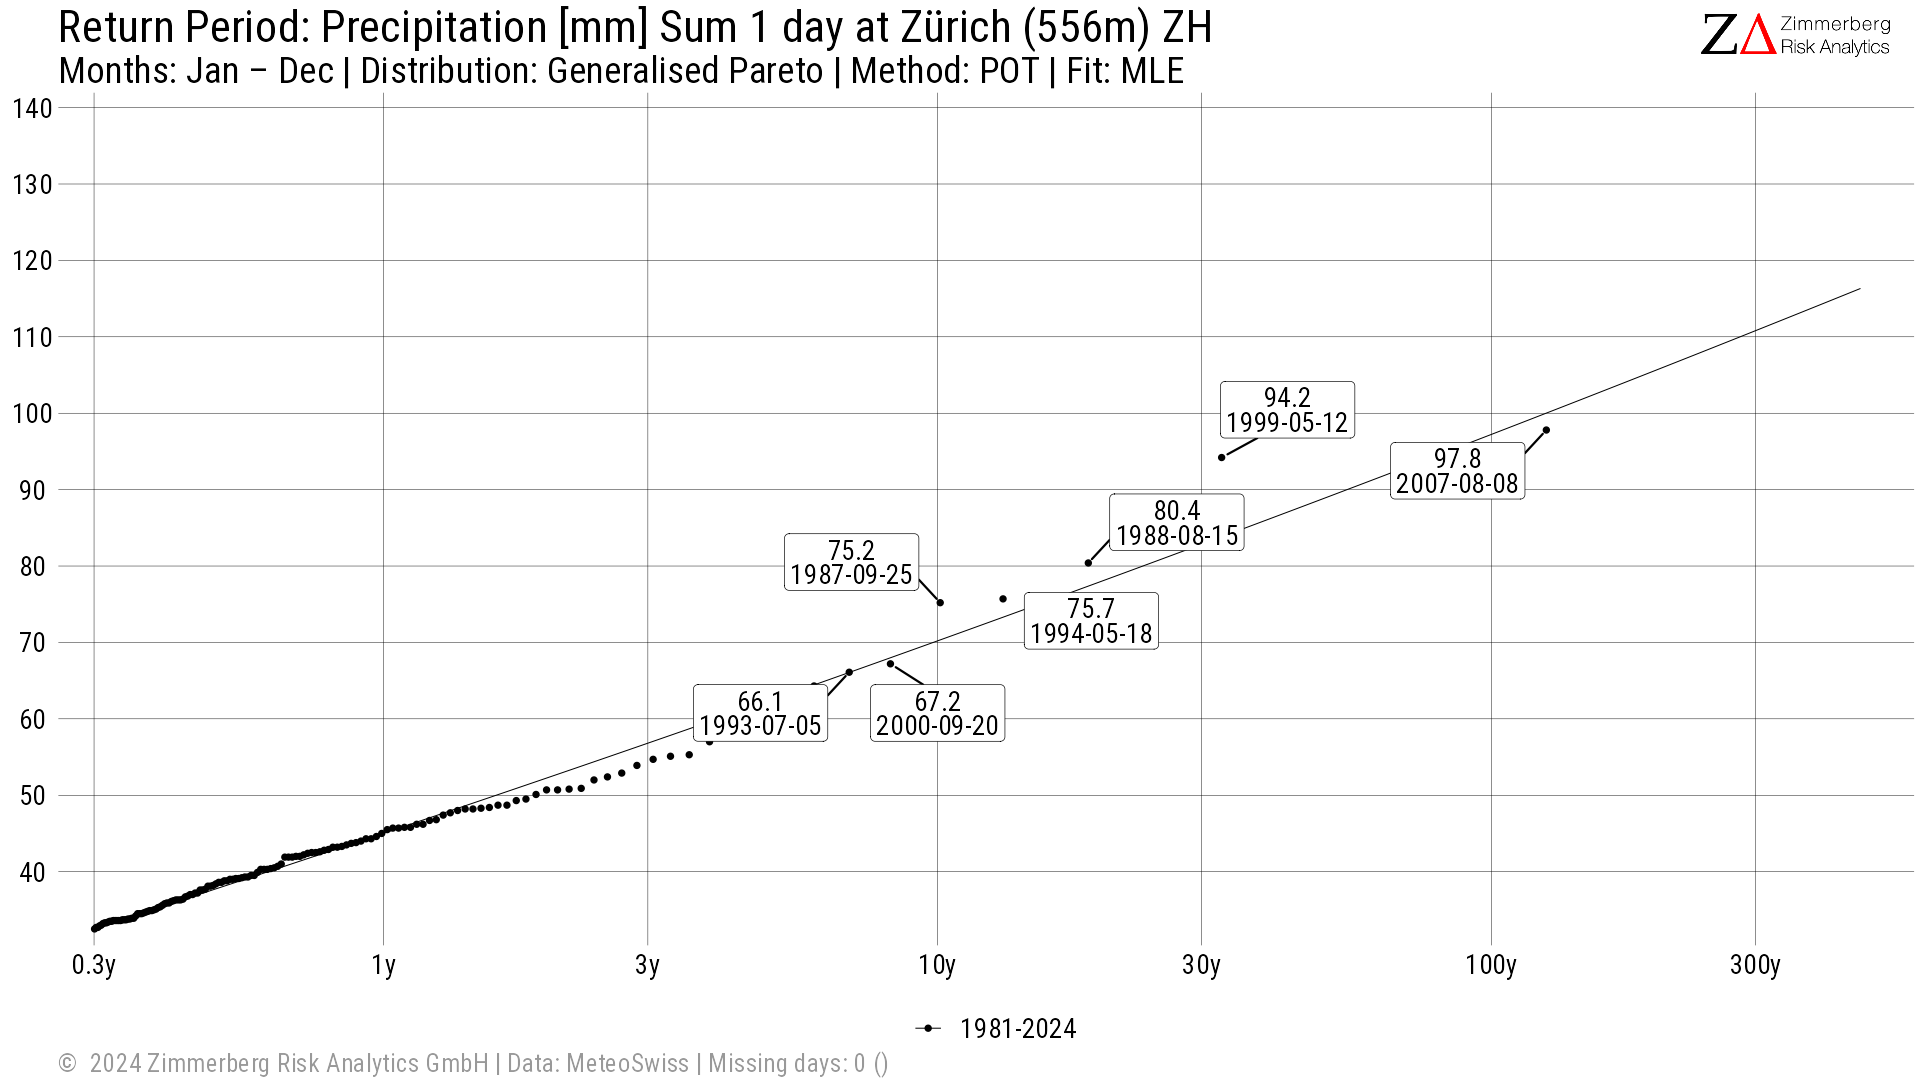
Extrema
Note: Return periods may be over-/understated due to climate change and changes in measurement location or instrumentation. Time range: last 40 years. Please refer to MeteoSwiss website for a comprehensive extreme value analysis.
Resources
The Swiss National Basic Climatological Network (Swiss NBCN) connects the major ground-based stations within the MeteoSwiss monitoring network. It consists of 29 climate monitoring stations and 46 precipitation stations. The measurement series available in digital form for temperature, precipitation and hours of sunshine date back, in some cases, to the mid-nineteenth century.
MeteoSwiss has been conducting systematic measurements of climate parameters at ground level in all parts of the country since 1864. Certain monitoring stations in this network are run with particular precision and are the bedrock for research into climate change. The particular ground-based monitoring stations in the network that are the most important from a climatological perspective together form the Swiss National Basic Climatological Network (Swiss NBCN). These provide the basis for long-term, continual high-quality climate data series. MeteoSwiss